Signals from a Turbulent Market
BTC loses its 50W average, but reset positioning, cycle timing, and washed-out breadth support the case for a bounce.


Investing in digital assets or tokenized equities, and their respective derivatives, involves a substantial degree of risk. Market prices can be highly volatile and unpredictable. Movements in the market can result in significant, rapid, and potentially total loss of your invested capital. Before allocating capital, you should carefully evaluate whether such investments align with your financial situation, experience, and risk tolerance. For further information regarding potential risks, please refer to the disclaimer below.
Crypto extended its decline in November, with BTC at $73.8K (as of the Nov 11 close, -5% MTD) and ETH near $2,050. The pullback has coincided with an AI-led equity sell-off and a hot October CPI print that has fed funds futures pricing a hike at the Dec 9 FOMC (100% probability for at least 1 hike).
Several signals line up on the bear side: BTC has lost its 50W SMA, ETH is retesting $2K, and potential tax-loss harvesting from underwater crypto ETF holders could add selling pressure into year end. For bulls, BTC’s 200W MA ($68K) may limit downside, speculative tokens have retraced their October rallies, and washed-out breadth suggests that much of the recent move down may be behind us. Moreover, the 4-year cycle, if it holds, points to improving conditions after a November or December low, which could spur constructive positioning.
BTC Loses the 50W SMA and ETH Tests $2K, Raising the Risk of a Further Slide
BTC closed below its 50W SMA (about $75.6K) on Nov 5, ending a seven-week streak above it, and on each day since Nov 7. ETH has been below its own 50W SMA ($2.3K) for about a week and sits within 3% of the psychological $2.0K level it lost on Feb 5, Mar 27 and Jun 2 this year. ETH ETFs have seen outflows of approximately $740M year to date as of Nov 11 (vs $1.5B for BTC ETFs), including $185M on Nov 9 alone.
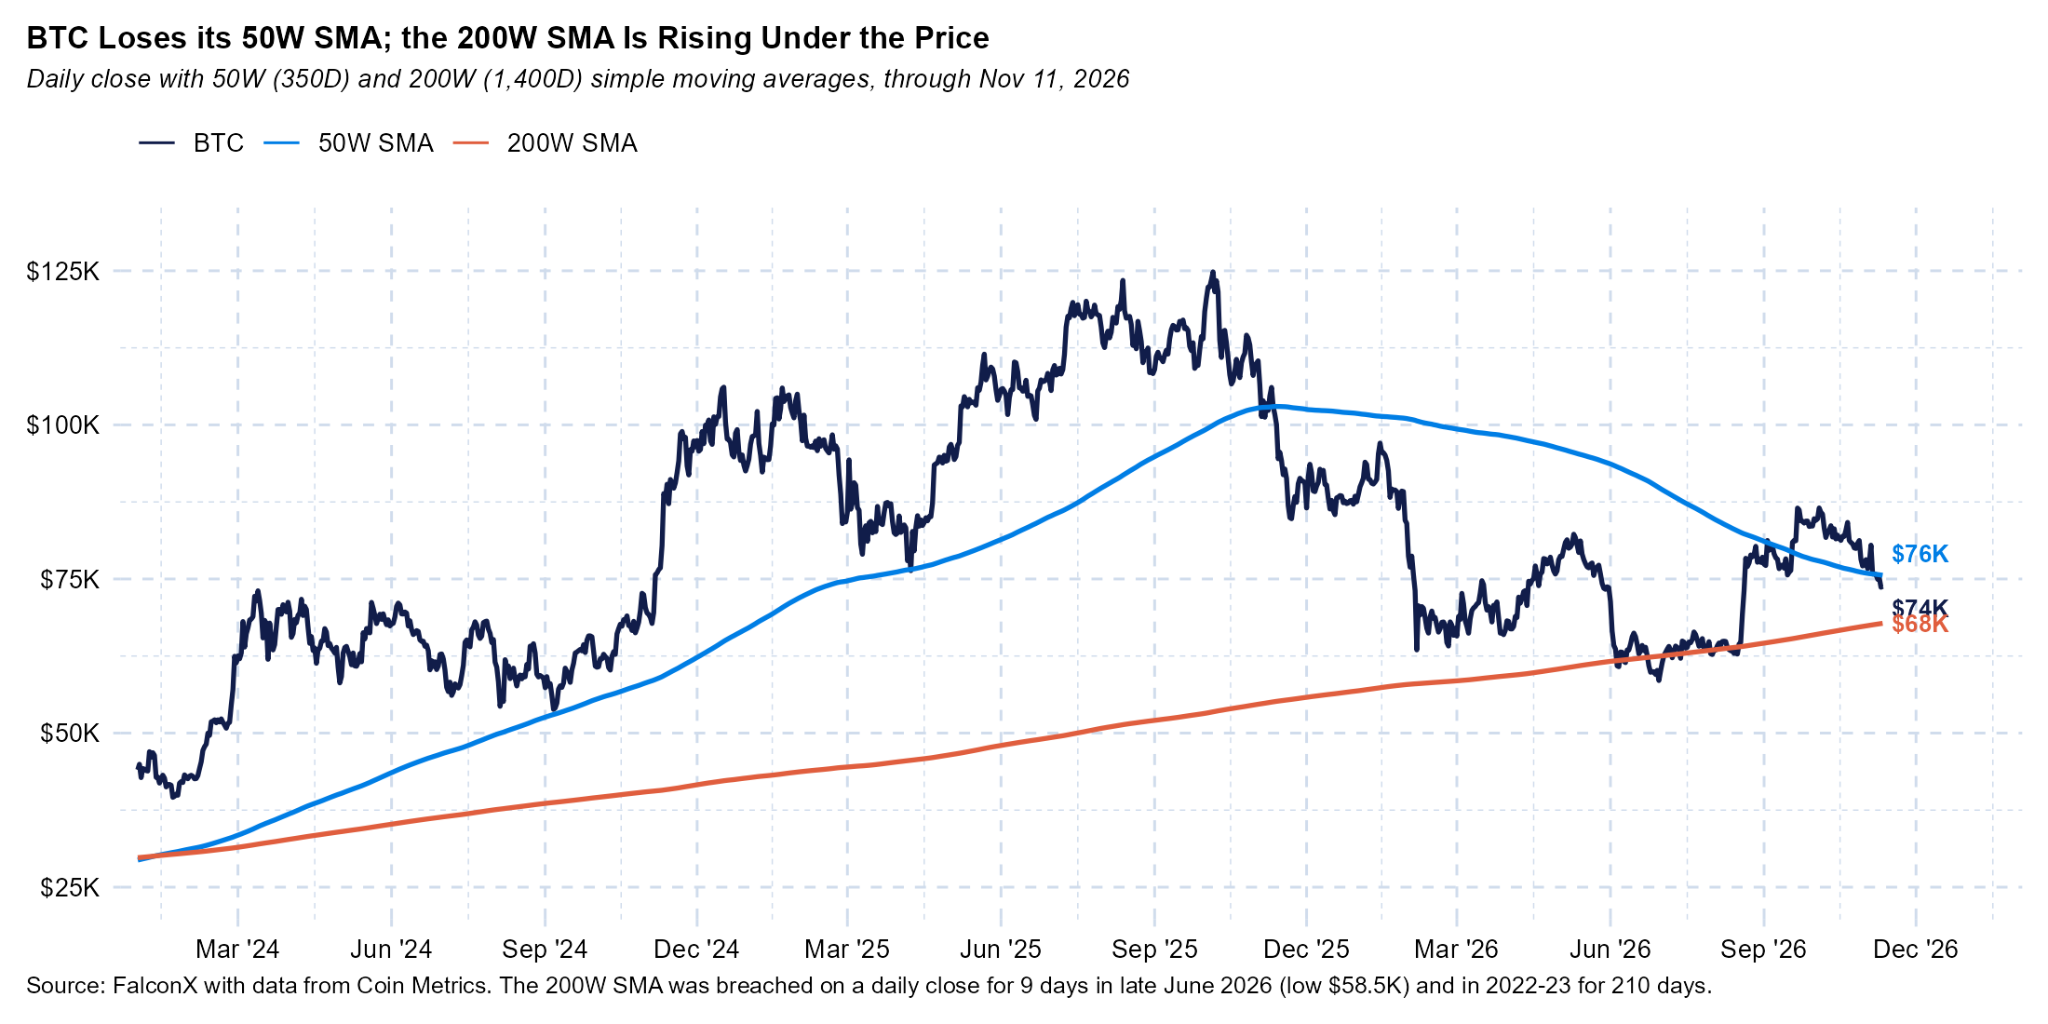
On weekly closes, the median 13-week return for BTC after a close below the 50W SMA since 2020 was -1.9% (7 events since 2020; the mean was +8.1%, and the median is -11.9% if the two Dec 2019 breaches are included). Extending the history to 2012 makes it worse: a median of -9.1% over 13 events (31% positive), with a mean of +1.2% lifted by a few large rallies.
Breaches on the weekly close tended to precede greater declines in price when they followed a failed rally (Dec 2019, Dec 2021-Apr 2022, Nov 2025) and less so when they marked a first dip in an uptrend. The latest breach (Nov 5) came after the Nov 2025 cross and a 10-month stretch (Nov 2025 to mid-Sep 2026) below the average, which makes it closer to the failed-rally cases.
Tax-Loss Harvesting Is a Year-End Overhang
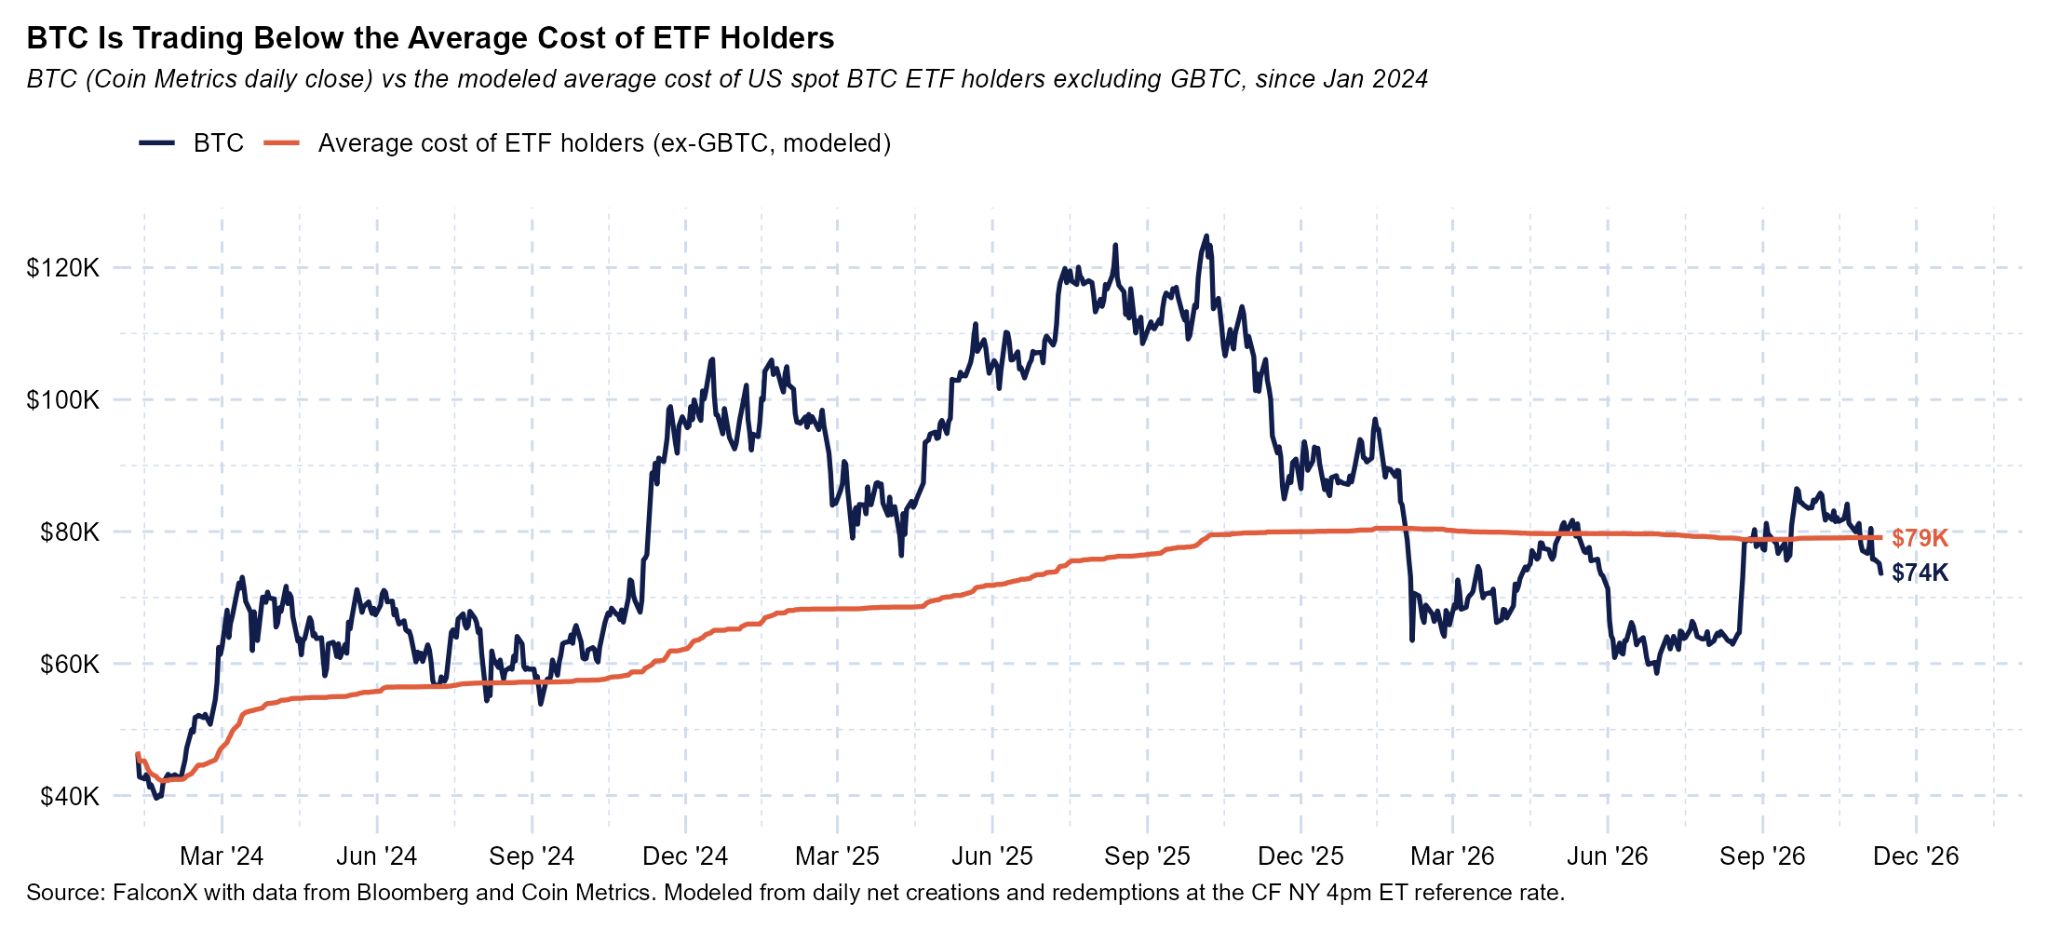
BTC sits roughly 16% below its Dec 31, 2025 price ($87.5K) and below the short-term holder cost basis ($75.7K). To size potential tax-loss selling, we rebuilt the cost of US spot ETF holders by cohort from daily net creations and redemptions, excluding GBTC, whose holders are mostly legacy investors with low cost bases. The remaining 1.11M BTC (within 3% of CheckOnChain's balance for the same funds) has an average cost of $79.1K, about 7% above the current price.
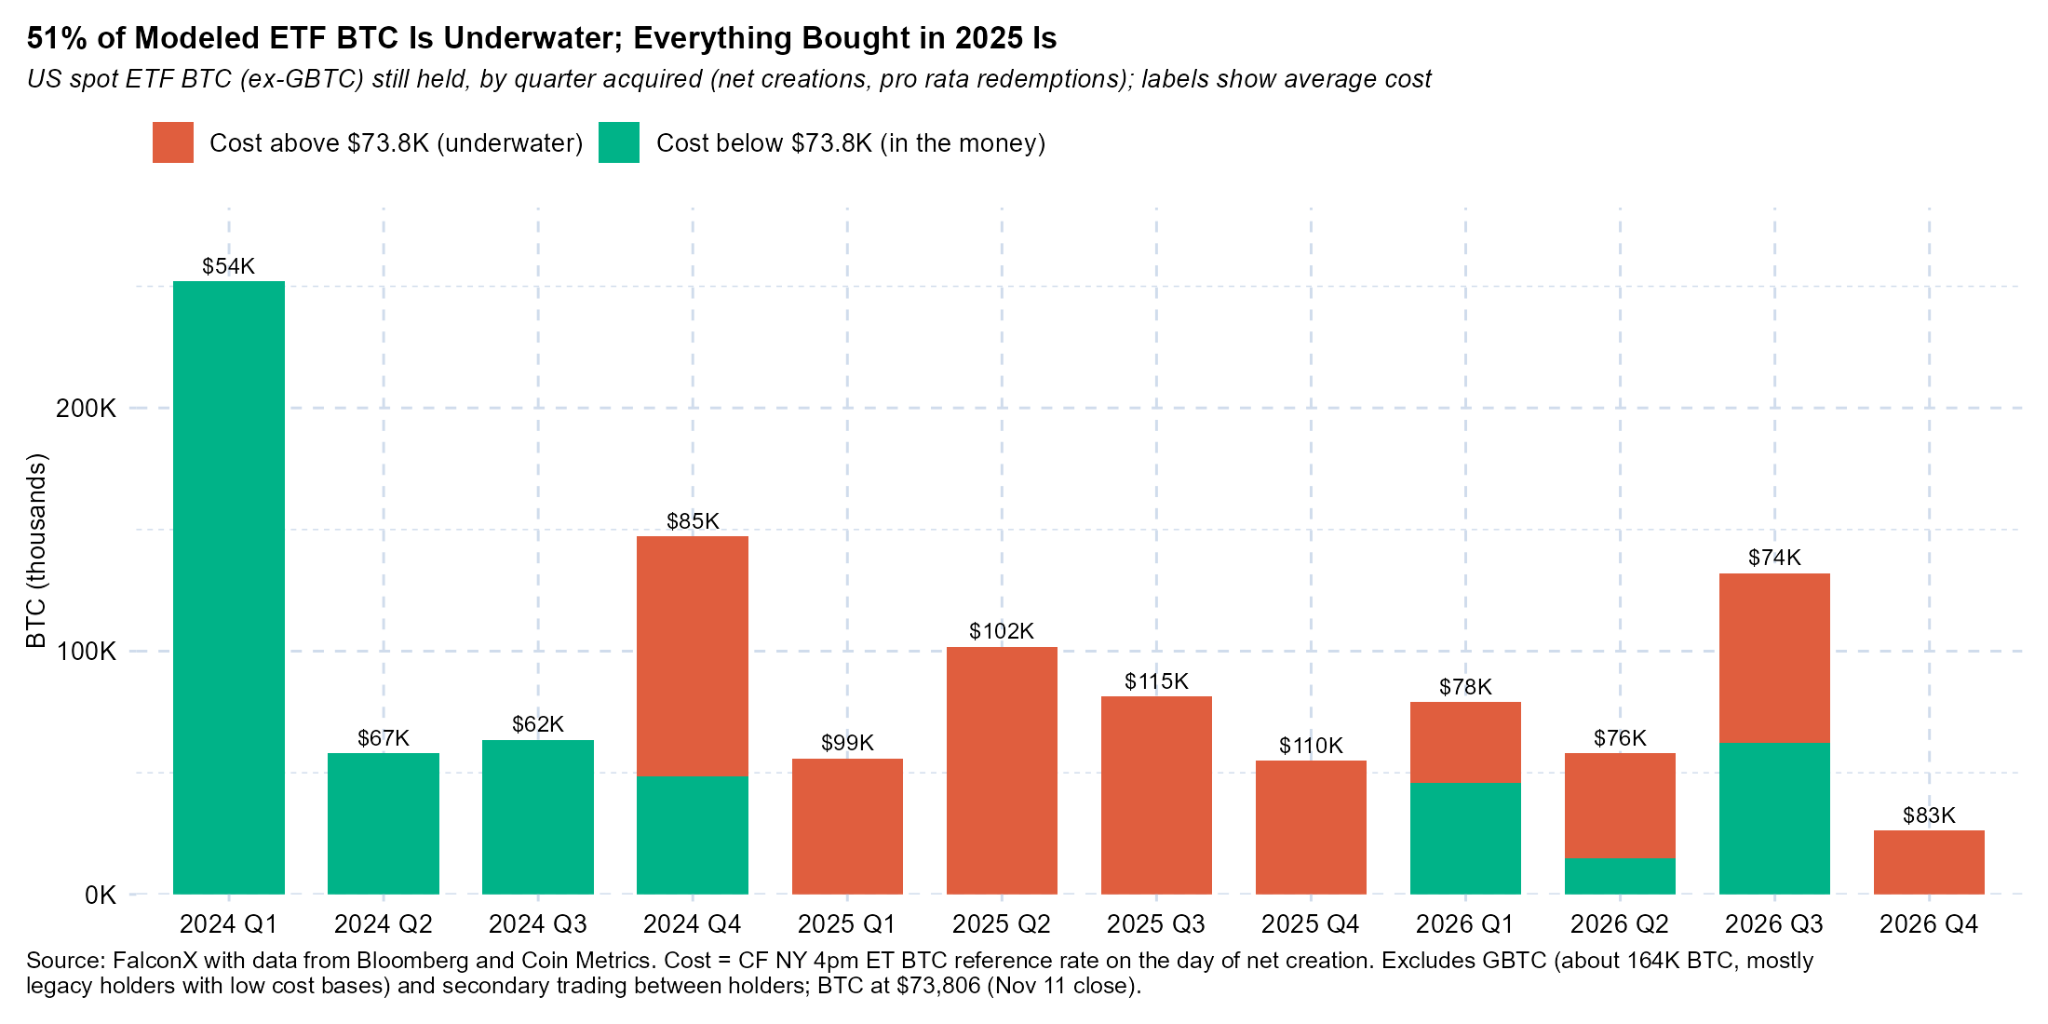
At $73.8K, 51% of that BTC (564K) was bought above the current price, a gross unrealized loss of $13.0B ($5.9B net of gains on the rest). All BTC bought in 2025 is underwater, including 55K BTC bought in Q4 at an average cost of $110K. Treating GBTC as in the money, underwater BTC is about 45% of the 1.27M BTC held across all US spot ETFs.
We assume 30-70% of the underwater BTC is in taxable hands, 15-50% of those holders harvest losses, and 10-50% of harvesters fully exit. That implies net selling of roughly 2.5K to 99K BTC ($0.2B-$7.3B), with a base case near 17K BTC ($1.3B), or about two to three days of Coinbase BTC-USD volume (30D average of $516M a day, per Coin Metrics).
For context, BTC ETFs (excluding GBTC) saw $4.0B of net outflows across Nov-Dec 2025, per data from Bloomberg, so harvesting looks like a modest additional overhang rather than a market-breaking event. Last year, the share of ETF BTC that was underwater rose from 15% to 43% between Oct 31 and Dec 31, 2025, per our calculations, yet December net outflows were only 10K BTC ($0.9B, against $3.2B in November), according to data from Bloomberg, with no obvious year-end harvesting spike and little sign of swaps between ETF vehicles.
200W SMA: The Next Support Level
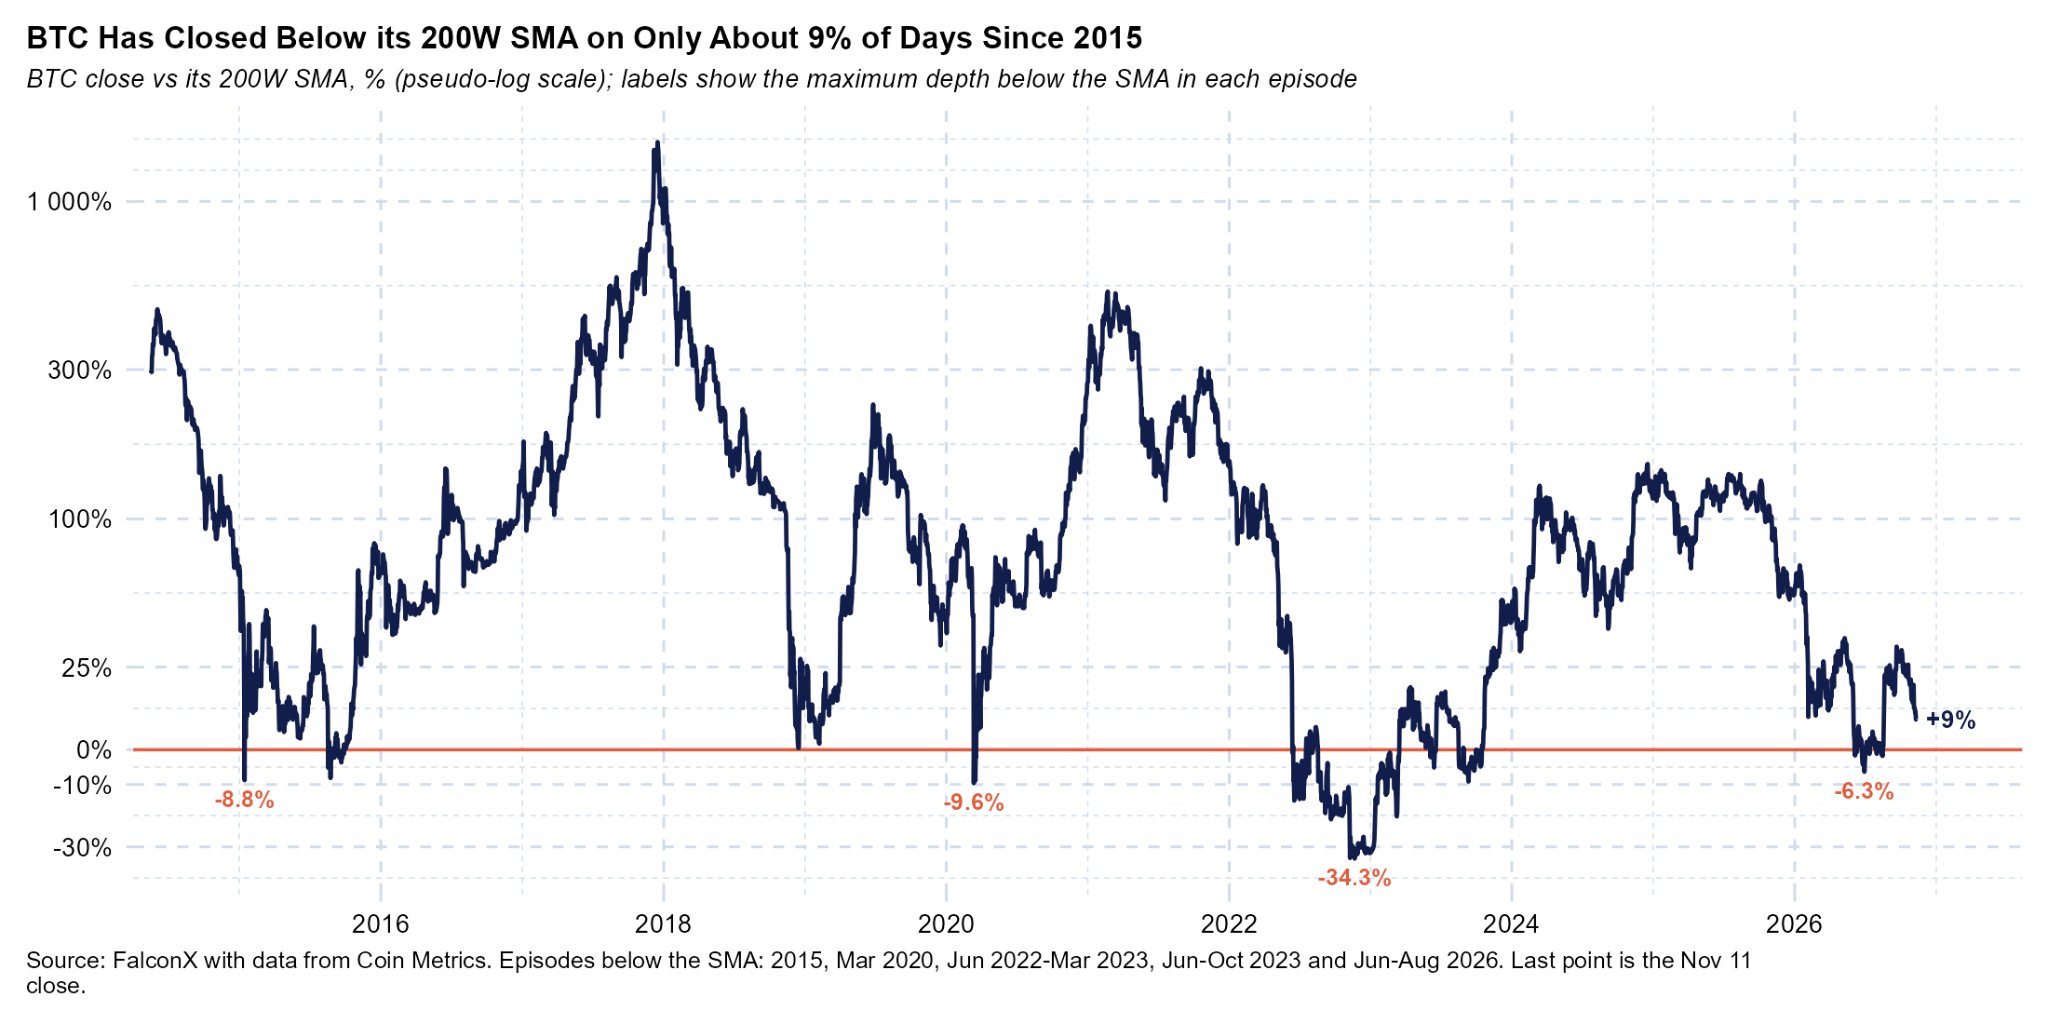
Despite the bearish indicators, downside for BTC may be limited at the 200W SMA ($67.8K), the next major support level, roughly 8% below spot. Historical trends suggest it is a robust signal with most breaches relatively brief; BTC has closed below it in only 14 distinct episodes since 2015, and 11 of them lasted 15 days or less.
This year’s episode is encouraging; BTC largely oscillated around the 200W SMA during the June selloff, closed below it on 11 days that month (including a nine-day run from Jun 24 to Jul 2), with a low close of $58.5K on Jun 30 (6.3% below the 200W SMA, which was then about $62.5K). Considering this activity, if BTC continues to slide and cracks below the $70K level, traders may be poised to bid more aggressively at ~$68K.
Narratives Have Died Down
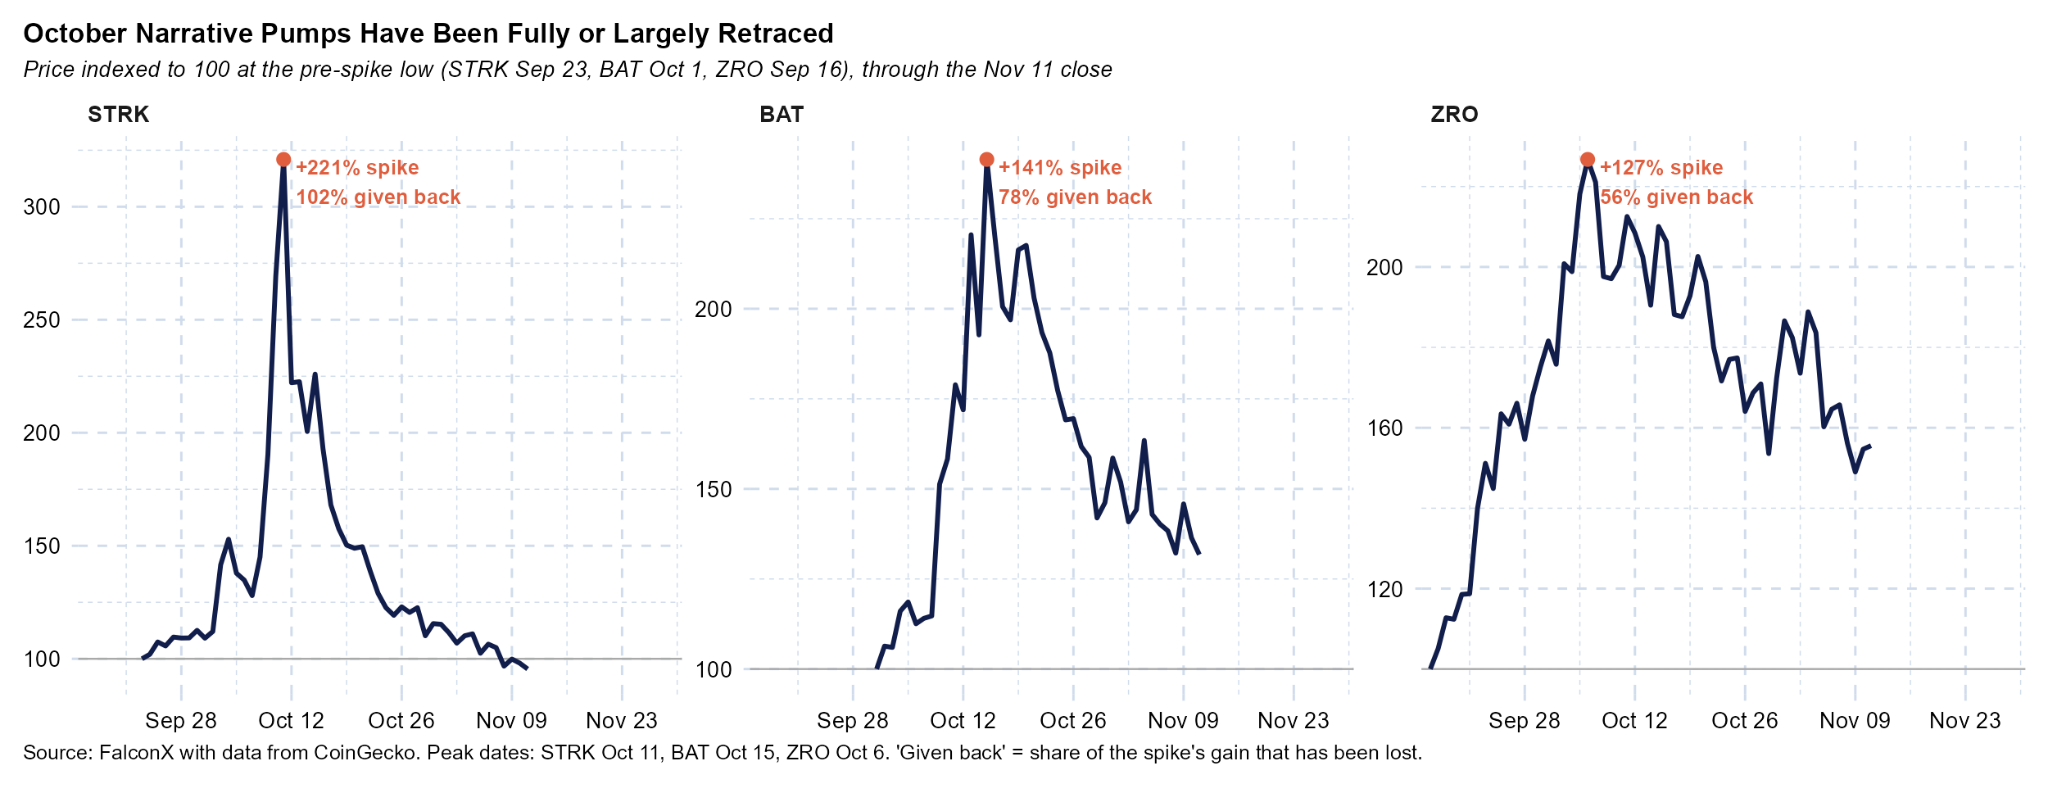
October's news-driven token rallies have been almost entirely retraced, signaling a reset in speculative positioning. Starknet (STRK), which rallied on news of a potential pivot towards becoming a quantum-resistant L1, rose 221% in 18 days to Oct 11 and has given back 102% of the move, per data from CoinGecko. Basic Attention Token (BAT) rose 141% to Oct 15 on optimism around its upcoming card offering and has given back 78%, and LayerZero (ZRO) rose 127% to Oct 7 and has given back 56% as participants look towards the launch of its L1 blockchain (announced for Nov 30).
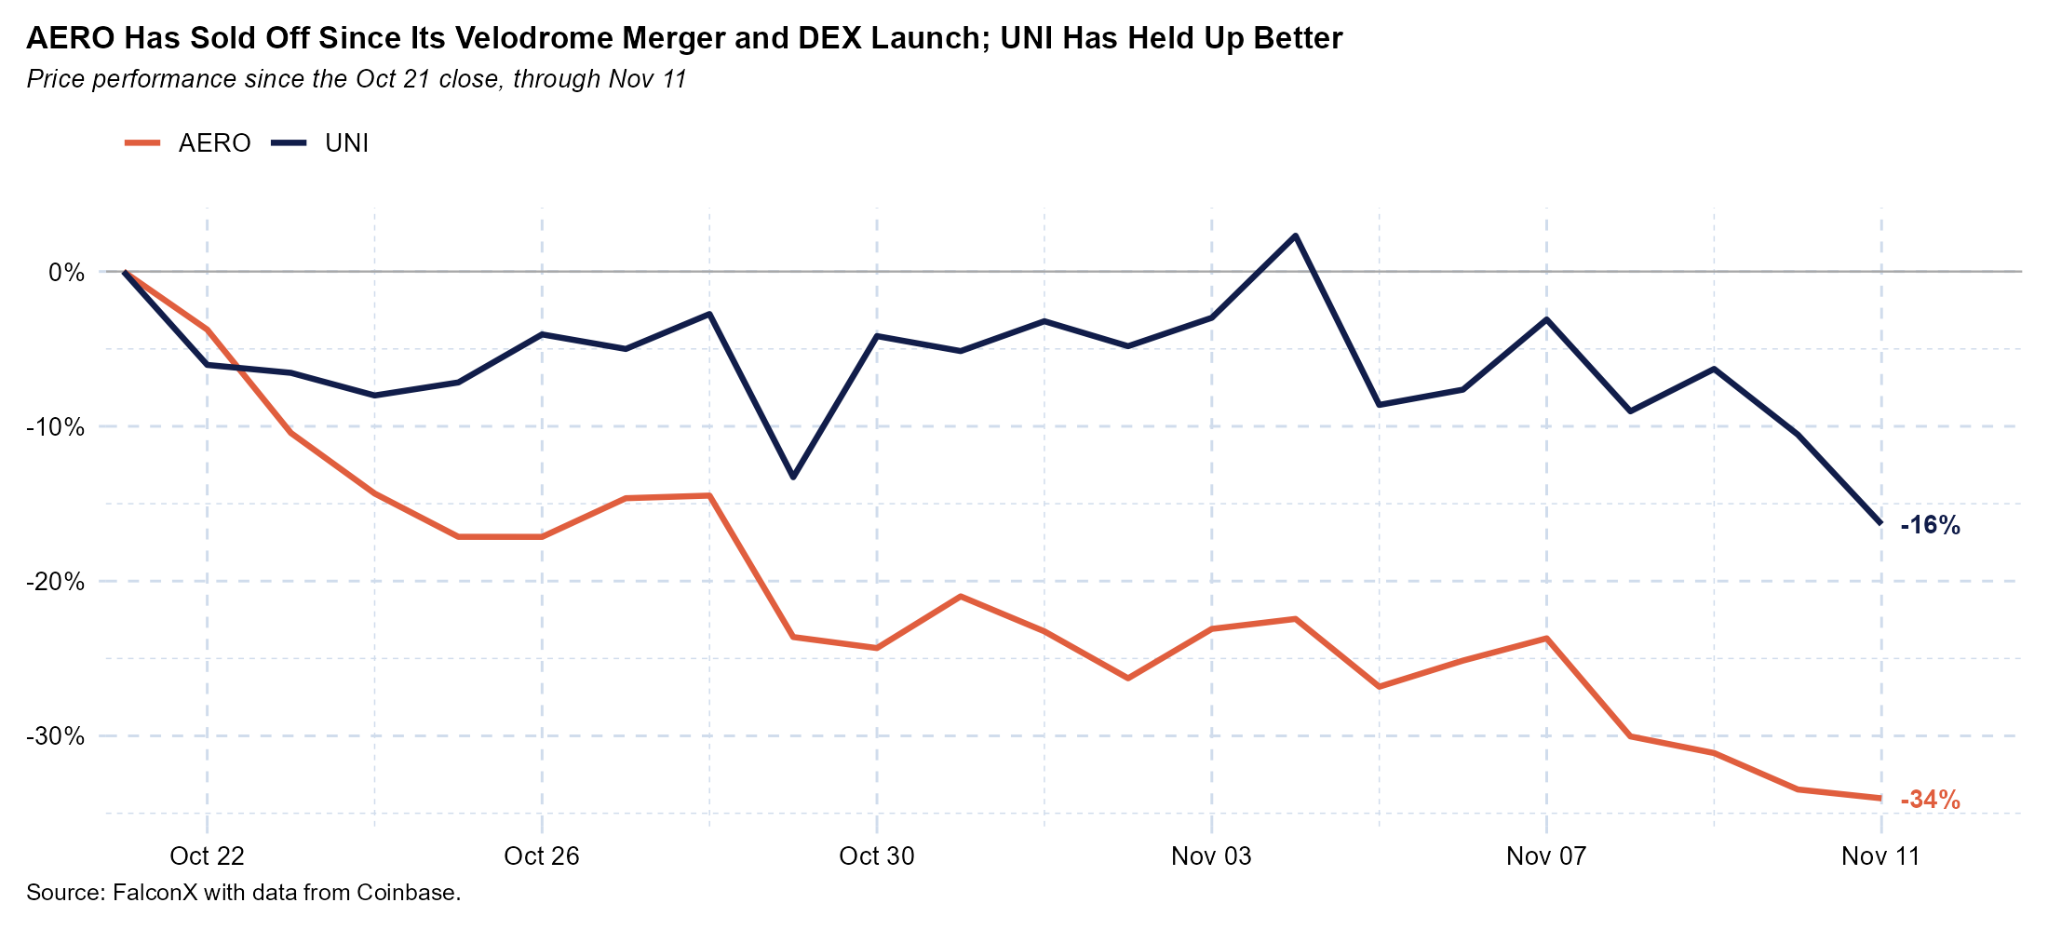
Performance for names with highly anticipated events tell a similar story. AERO is -34% following its well-publicized Velodrome merger and DEX launch on October 21, which compares to peer UNI at -16% over the period (Coinbase prices, Oct 21 close to Nov 11 close). The performance suggests market participants are increasingly selling news and fading narratives, exemplifying the risk-off market lately. This retracement suggests speculative positioning has been reset, which leaves less froth to unwind and may be constructive for a bounce.
Breadth Has Washed Out, Suggesting Recent Contraction May be Over
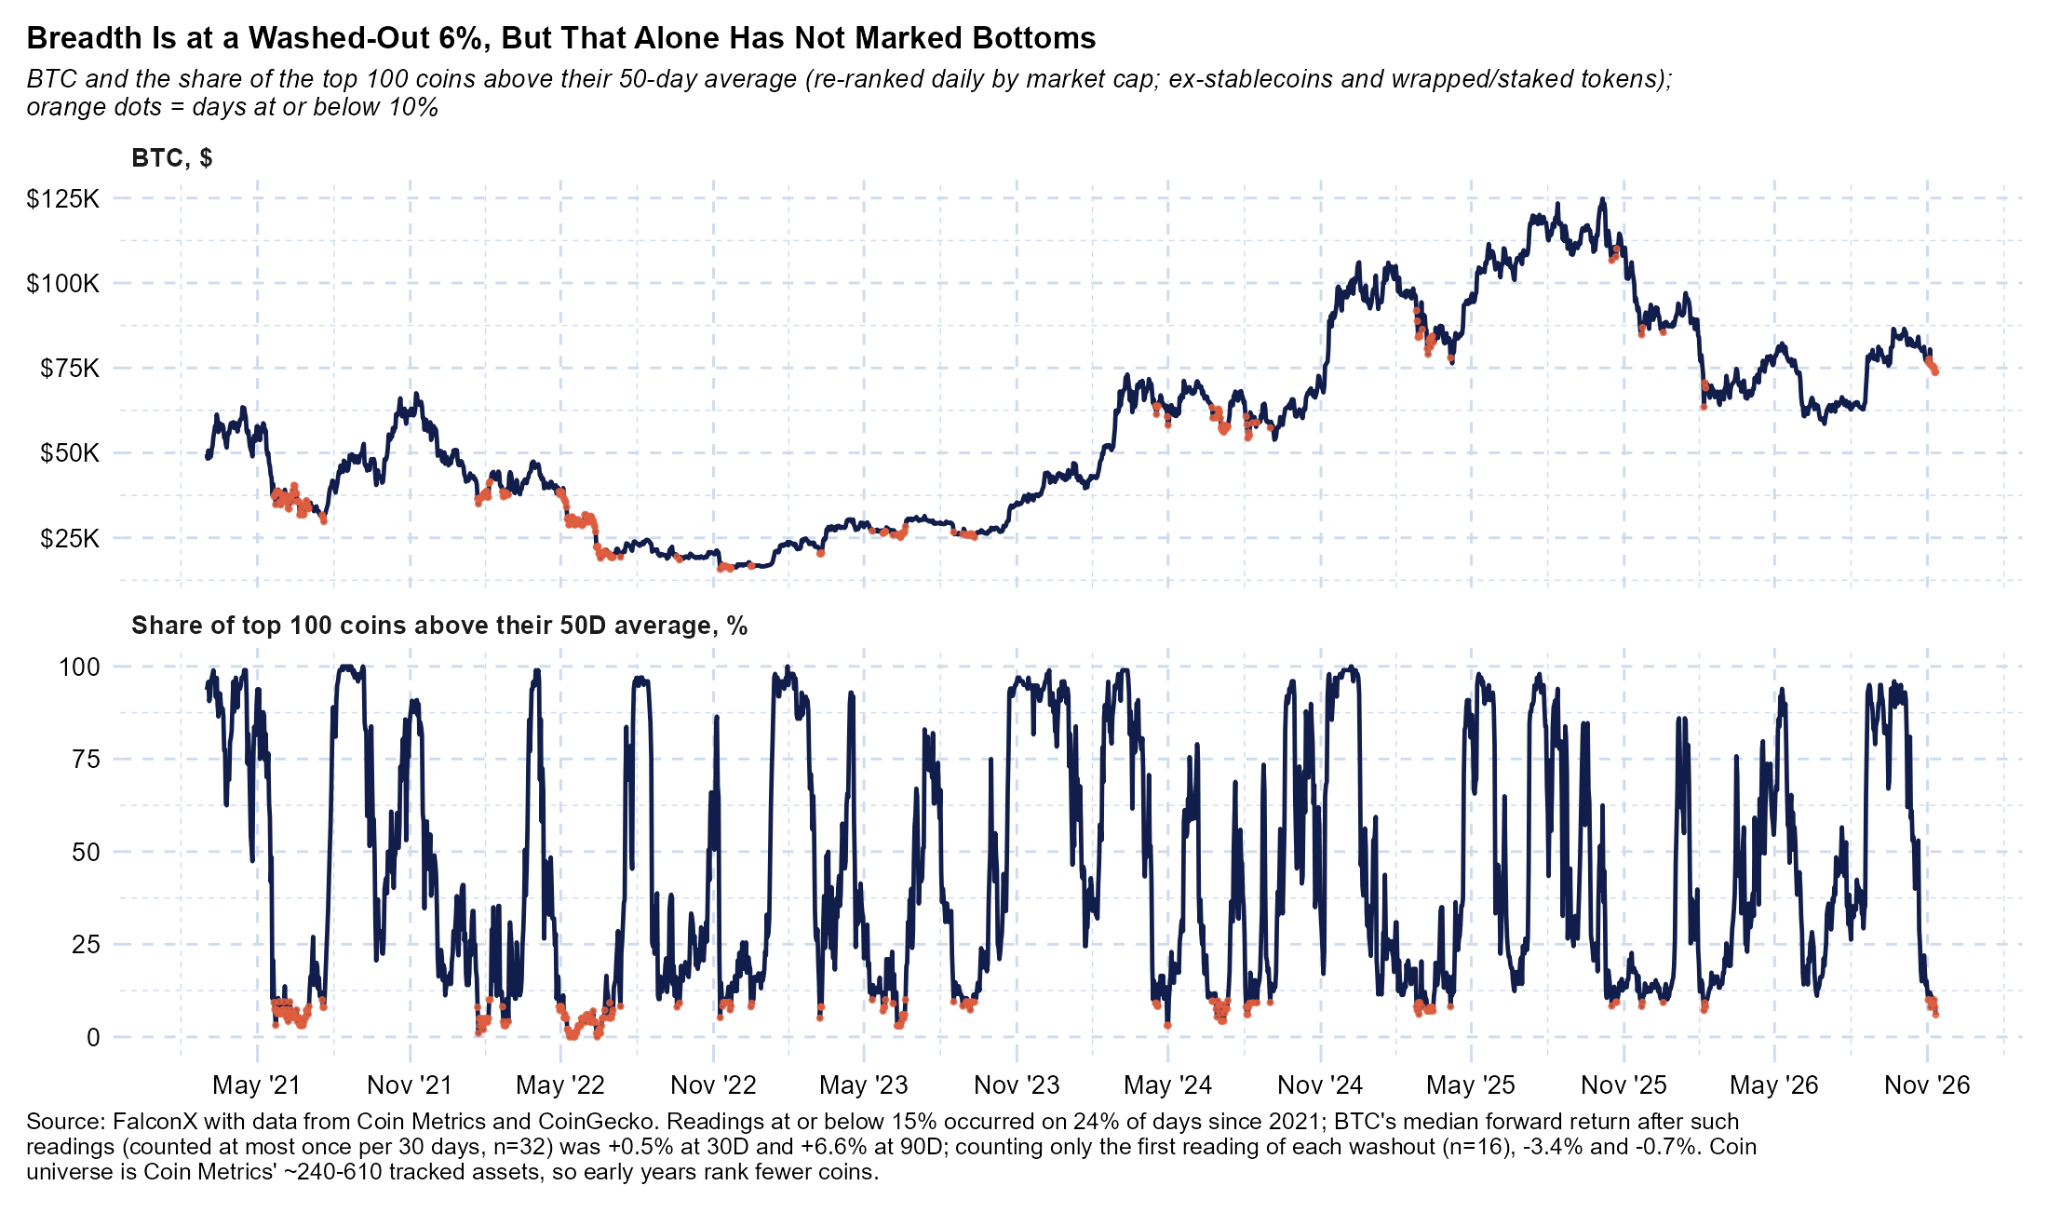
Our analysis shows that only 6% of the top 100 coins by market cap (ex-stablecoins and wrapped/staking tokens, re-ranked daily) are above their 50D average market cap, suggesting a broad-based reset in positioning.
Readings of 7% or below have been rare (nine distinct episodes since 2021) and BTC was higher 90 days later in eight of them, by a median of 13.5%, led by May 2021 (+41%), Nov 2022 (+48%) and Feb 2025 (+28%); the exception was May 2022, when BTC fell 38%. Breadth reached 6% on Nov 11, the first reading at or below 7% since Feb 2025. At a looser threshold, across 32 readings of 15% or below since 2021 (counted at most once every 30 days), BTC's median return was +0.5% over 30D and +6.6% over 90D (55% positive). All in, current levels see parallels to periods with local lows historically and could point to a bounce in the coming weeks.
The Four-Year Cycle Suggests Nov/Dec Could Mark the Low
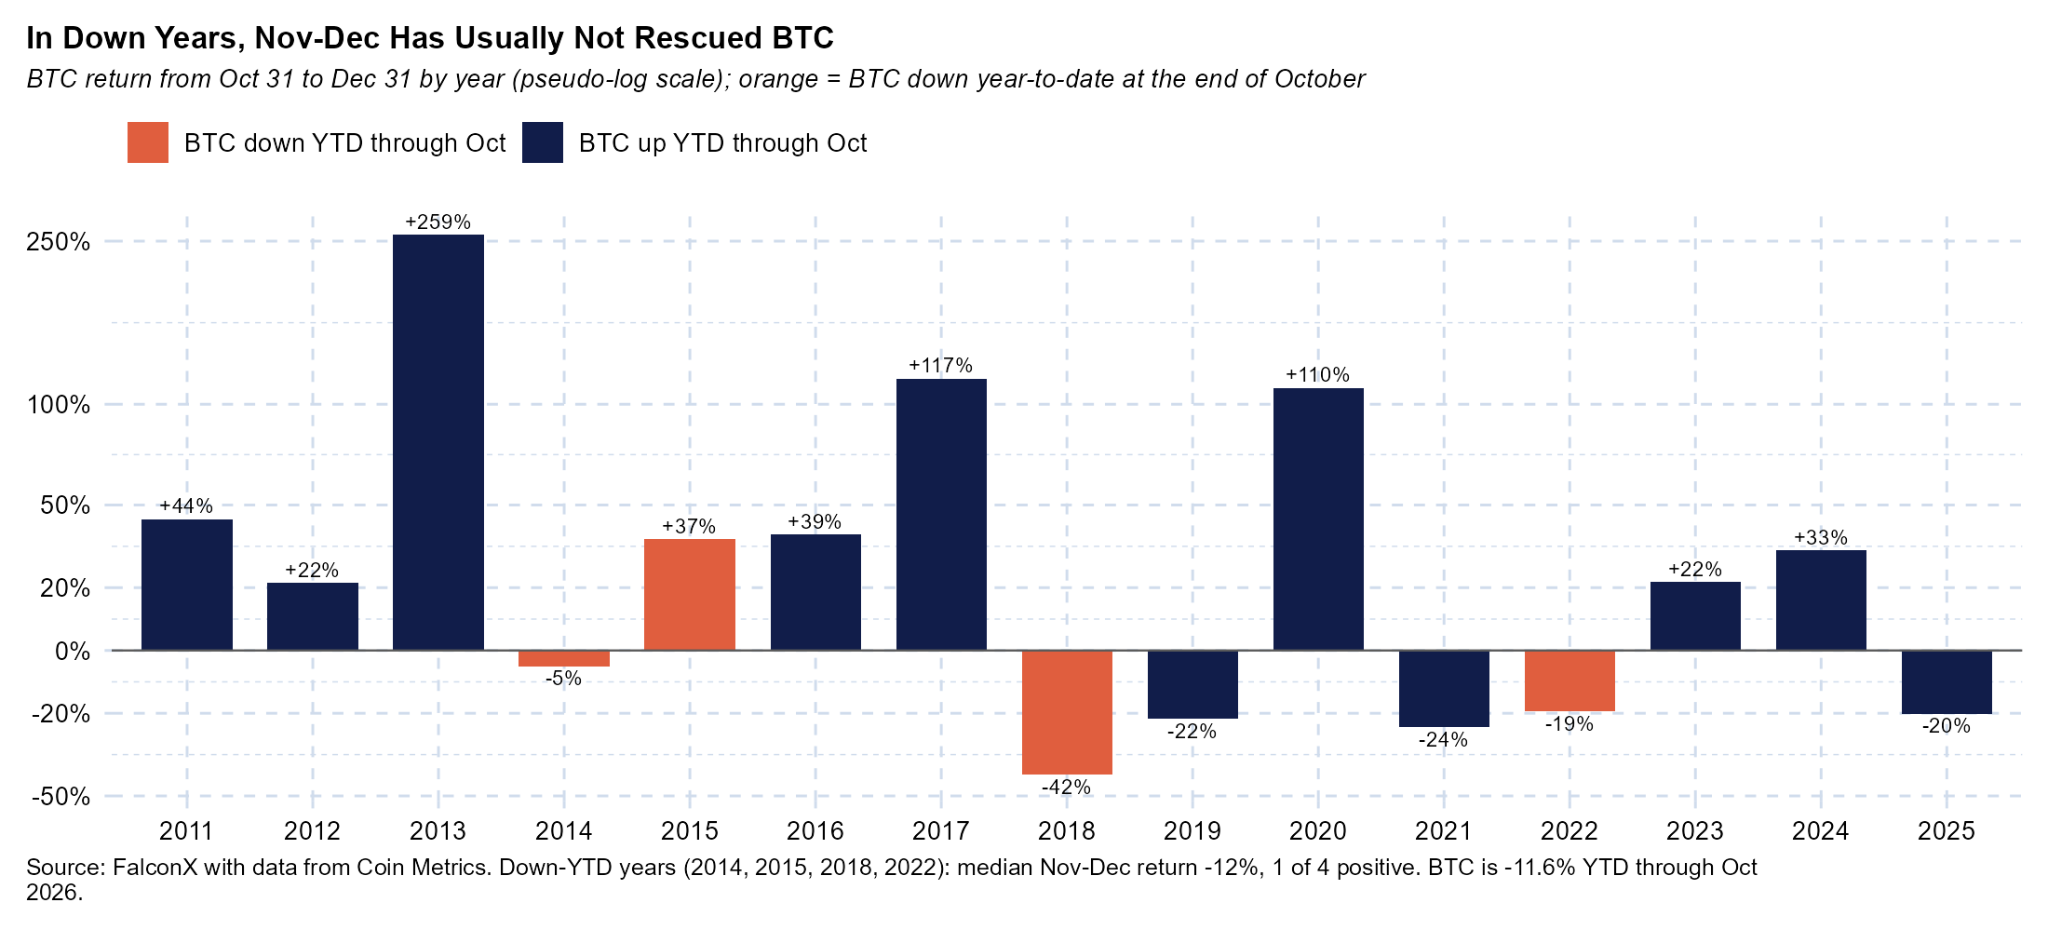
Seasonality is a headwind for the rest of the quarter. In years when BTC was down year to date through October (2014, 2015, 2018 and 2022), the median Nov-Dec return was -12%, with only one of four positive. However, three of the four prior cycle lows (2011, 2018 and 2022) also came in Nov-Dec, the window the cycle points to now.
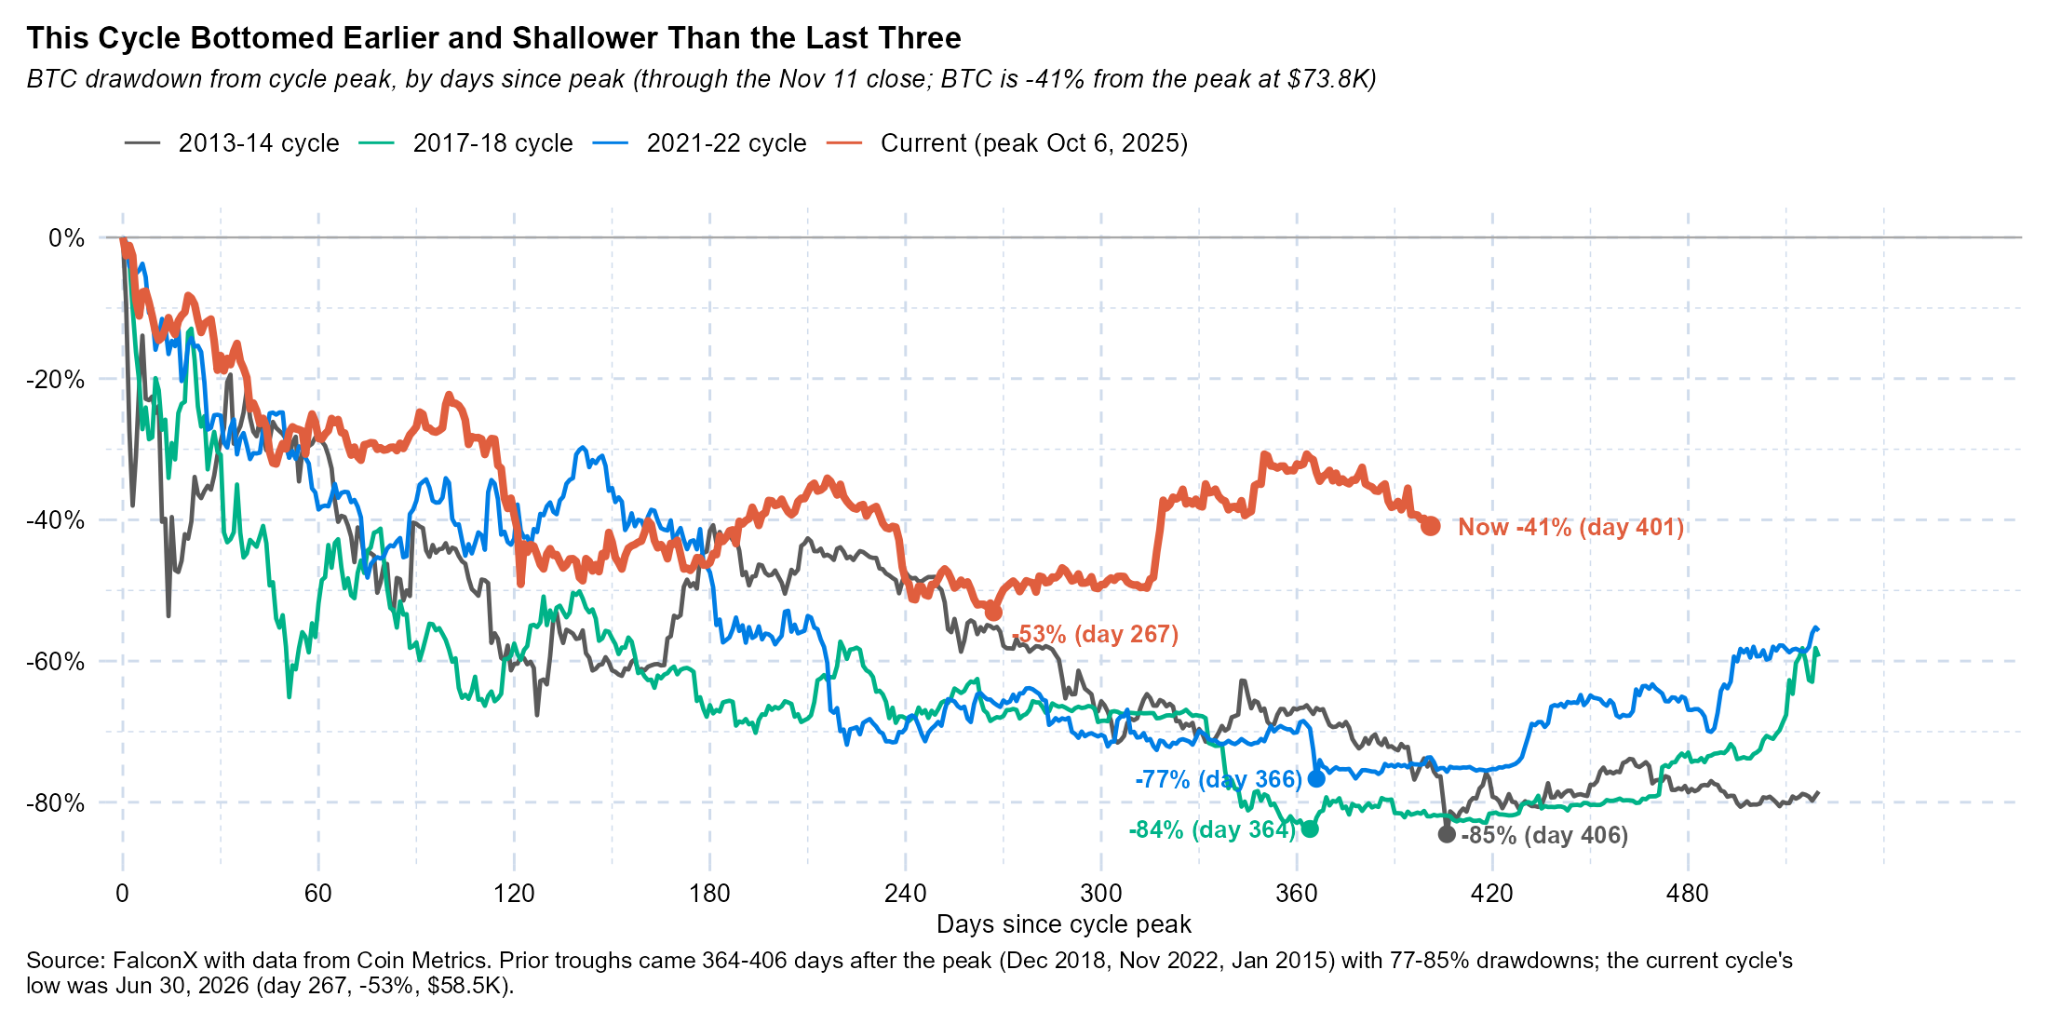
Prior cycles bottomed 364-406 days after the peak (Jan 2015, Dec 2018, Nov 2022) with drawdowns of 77-85%. The current cycle peaked on Oct 6, 2025 ($124.8K) and has so far bottomed on Jun 30, 2026 at $58.5K, day 267 and 53% below the peak, after BTC closed 6.3% below its 200W SMA. BTC is now 26% above that low and 41% below its peak at day 401. The traditional Nov-Dec time window for a cycle low now coincides with a price that is well above the June low. This trend may support more constructive positioning into Q1 from participants that believe the 4-year cycle still holds.
Takeaways
BTC under its 50W SMA and ETH retesting $2K could foreshadow a further move down, and current price levels could drive tax-loss harvesting from underwater BTC ETF holders into year end. On the other hand, weak breadth and a retracement in tokens with narratives suggest a reset in speculative positioning and could support a bounce, in line with the 4-year cycle historically pointing to a Nov-Dec low.
This material is for informational purposes only and is only intended for sophisticated or institutional investors. Neither FalconX Limited, FalconX Bravo, Inc., FalconX Delta, Inc., FalconX Golf Pte Ltd., Solios, Inc., Falcon Labs S. DE. R. L., KestrelX, Ltd., KingfisherX Limited, nor Banzai Pipeline Limited service retail counterparties, and the information in this material is NOT intended for retail investors. This material is not (i) an offer, or solicitation of an offer, to invest in, or to buy or sell, any interests or shares, or to participate in any investment or trading strategy, (ii) intended to provide accounting, legal, or tax advice, or investment recommendations, or (iii) an official statement of FalconX or any of its affiliates. Any information contained in this material is not and should not be regarded as investment advice, investment research, debt research, or derivatives research for the purposes of the rules of the CFTC, the Securities and Exchange Commission, or any other relevant regulatory body.
No discussion of a particular company or product shall be considered an endorsement of such company or product. Past performance is not indicative of future results. FalconX, and its affiliated parties, including 21shares, may hold positions in, act as a market maker for, or otherwise have a financial interest in, assets discussed herein, and may benefit from any price movements or transactions involving the subject company. This may change without notice.
Prior to entering into any proposed transaction, recipients should determine, in consultation with their own investment, legal, tax, regulatory and accounting advisors, the economic risks and merits, as well as the legal, tax, regulatory and accounting characteristics and consequences of the transaction. Pursuant to the Dodd-Frank Act, over the counter derivatives are only permitted to be traded by "eligible contract participants" (“ECP”s) as defined under Section 1a(18) of the CEA (7 U.S.C. § 1a(18)). Do not consider derivatives or structured products unless you are an ECP and fully understand and are willing to assume the risks.
Solios, Inc. and FalconX Delta, Inc. are registered as federal money services businesses with FinCEN. FalconX Bravo, Inc. is registered as a Swap Dealer with the U.S. Commodity Futures Trading Commission and is a member of the National Futures Association. FalconX Limited, FalconX Bravo, Inc., FalconX Delta, Inc., Falcon Labs S. DE. R. L., and Solios, Inc. are not registered with the Securities & Exchange Commission or the Financial Industry Regulatory Authority. FalconX Golf Pte. Ltd. is not registered or licensed by the Monetary Authority of Singapore (MAS). FalconX Limited is licensed by the MFSA as a Class 2 Crypto-Asset Service Provider (Regulation (EU) 2023/1114). It is also licensed as a Financial Institution (Cap. 376) exclusively for EMT payment services. FalconX is not a registered broker-dealer with the U.S. SEC or a member of the Financial Industry Regulatory Authority (FINRA). FalconX’s ability to offer trading in tokenized stocks and other products mentioned herein may be restricted in certain jurisdictions.
"FalconX" is a marketing name for the FalconX Group and its affiliates. Availability of products and services is subject to jurisdictional limitations and capabilities of each FalconX entity. For information about which legal entities offer trading products and services, or if you are considering entering into a derivatives transaction, please reach out to your Sales or Trading representative.