Can’t Stop, Won’t Stop? Strengthening Liquidity Trends Reinforce Confidence in the Rally
The market continues to inch higher as net flows into the spot BTC ETFs accelerated further over the past week. Checking liquidity conditions after a hefty price rally is an important but sometimes underestimated exercise. All in, overall liquidity metrics continue to suggest that the path of least resistance remains upward.

The market continues to inch higher as net flows into the spot BTC ETFs accelerated further over the past week. Net flows more than doubled over the past week to over $4 billion, with IBIT and FBTC in the 4th and 7th positions respectively in the rankings for total net inflows for all U.S. ETFs in 2024.
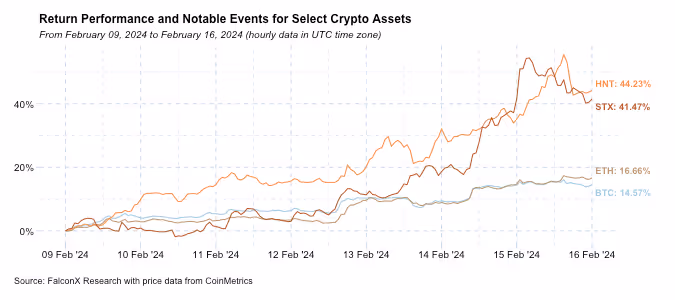
The total crypto market capitalization, as a result, grew by 14.8% (or 16.5% excluding stablecoins) to $1.9 trillion (or $1.7 trillion excluding stablecoins). ETH slightly outperformed BTC over the past seven days, as it historically tends to do in the weeks following major upgrades. More impressively, STX and HNT continue to deliver stellar performances fuelled by strong narratives within Bitcoin Layer 2 networks and decentralized physical infrastructure networks, respectively.
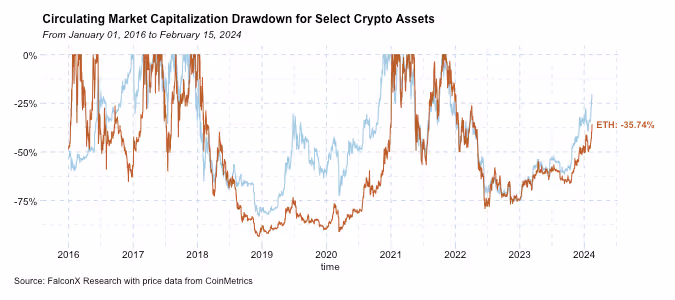
As the chart below shows, the BTC market capitalization is currently less than 20% off from its previous all-time high. ETH is lagging, as it did at this point in the last cycle but by a lower amount than back then. Non-BTC assets start to get spicy only after BTC breaks all-time highs, and I don’t see a good reason why it would be different this time.
Checking liquidity conditions after a hefty price rally is an important but sometimes underestimated exercise.
On one hand, price increases followed by lower volumes have historically been a reliable indicator of false breakouts in crypto. The double of top 2021 and the fake rallies of mid-2023 rallies have been textbook examples of how liquidity can signal potential market reversals. On the other hand, strong liquidity trends have also been critical for me to have confidence in the sustainability of the rally from last October.
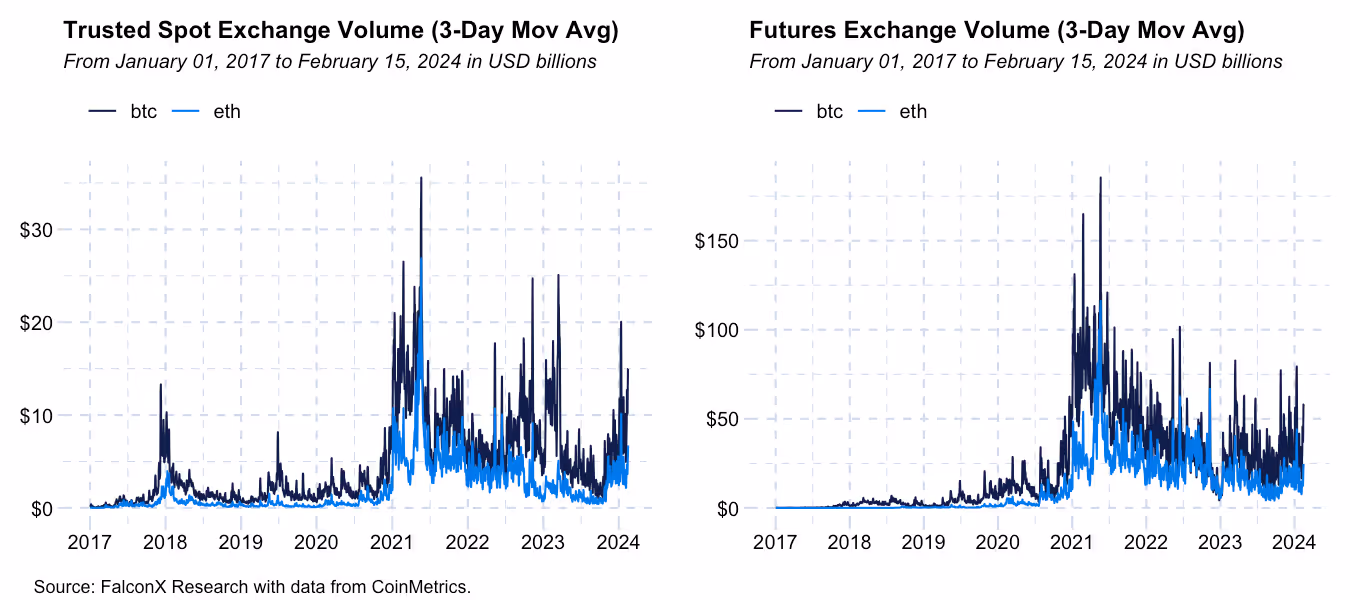
The good news at this point is that liquidity conditions surrounding the January rally remain generally robust. The chart below shows my favorite trade volume metric (CoinMetrics trusted exchange volume and futures volume for select exchanges, smoothed by a 3-day moving average) for both BTC and ETH. BTC just finished its fourth straight day trading over $10 billion per day. These are exceptional volumes: TThe last time it reached those levels was during the peak of the U.S. regional bank crisis in March 2023.
Other liquidity metrics are also by and large showing mostly favorable reads, with a few small signs of caution.
One critical but somewhat underrated factor that has been fueling the crypto bull market is how stronger trade volumes have been meeting relatively tight order books. Although there are some emerging signs of a potential change in direction, the BTC and ETH order books remain tight compared to historical levels.

Two notable changes regarding depth of market are emerging, though.
First, order book depth by this measure has been expanding slightly. The increase has been mostly in USD terms than in native unit terms, reflecting the strong market momentum over the past few weeks. Second, the book is expanding on the ask side (i.e., sellers) relative to the bid (i.e., buyers) side. This trend has been more pronounced in BTC than ETH, to the point that the BTC orderbook hasn’t been this skewed to the ask side since January 2023.
In a nutshell, this suggests that sellers are starting to expand their weight in the order book for the first time since mid-2023. The exceptionally strong ETF net inflows have been able to absorb this potential new pressure. Still, these changes in the orderbook dynamics are another reason to watch ETF inflows closely, as prices are now more likely to recede when buy flows recede.
At the same time, some leverage metrics continue to increase.
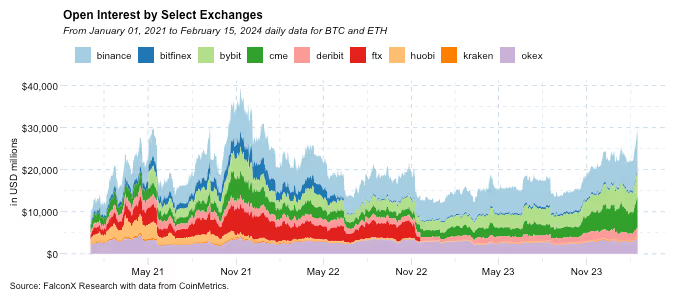
Futures open interest in BTC and ETH, for example, reached $30 billion. Led primarily by the CME and to a lesser extent by Binance, the open interest in BTC and ETH futures is now only 25% lower than the all-time high print at the peak of the previous market cycle. The last time it has been above $30 billion was at the very end of 2021.
High futures open interest reflects market bullishness but also brings leverage, and therefore potentially volatility ahead. According to this metric, investors who appreciate downside protection from sharp corrections amidst the current bull market might find this an adequate environment to do so.
The positive outlook remains intact, but it is important to remember that crypto bull markets don’t come without temporary corrections on the way. The broader macro environment also continues to gain importance in crypto price formation (since we highlighted this factor, the correlation between BTC and SPY increased from 0.09 to 0.36), and any changes there should be closely monitored.
All in, overall liquidity metrics continue to suggest that the path of least resistance remains upward.
Other Top Trends We're Watching
FalconX Trading Desk Color: Our desk activity from last week was one more time led by BTC, as the buy flow related to spot ETFs remains strong. While our average BTC/ETH volume ratio is between 1.5 and 2.0x, it has been hovering at over 4-5x since the ETF launch. Beyond the ETF-related activity, prop desks remained slightly better sellers (51% of total flow) while hedge funds turned to better buyers (59% of total flow). We continue to see bullish ETH interest from hedge funds and prop desks (over 60% of total flow) and venture funds (56%) compensated by sell interest from other personas, such as retail aggregators. Among alts, our flow was tilted toward the sell side for names such as SOL, ARB, and MATIC while activity in AVAX, LDO, and SUI came primarily from the buy side.
CME BTC Futures Contracts Basis Starting to Edge Up: After shrinking significantly after the spot BTC ETF launches on January 11, the CME basis has started to expand again, as the chart below shows. The increase has been most notable in the shorter maturities: with the estimated basis over the next 30 days reaching a whopping 18.1% annualized.
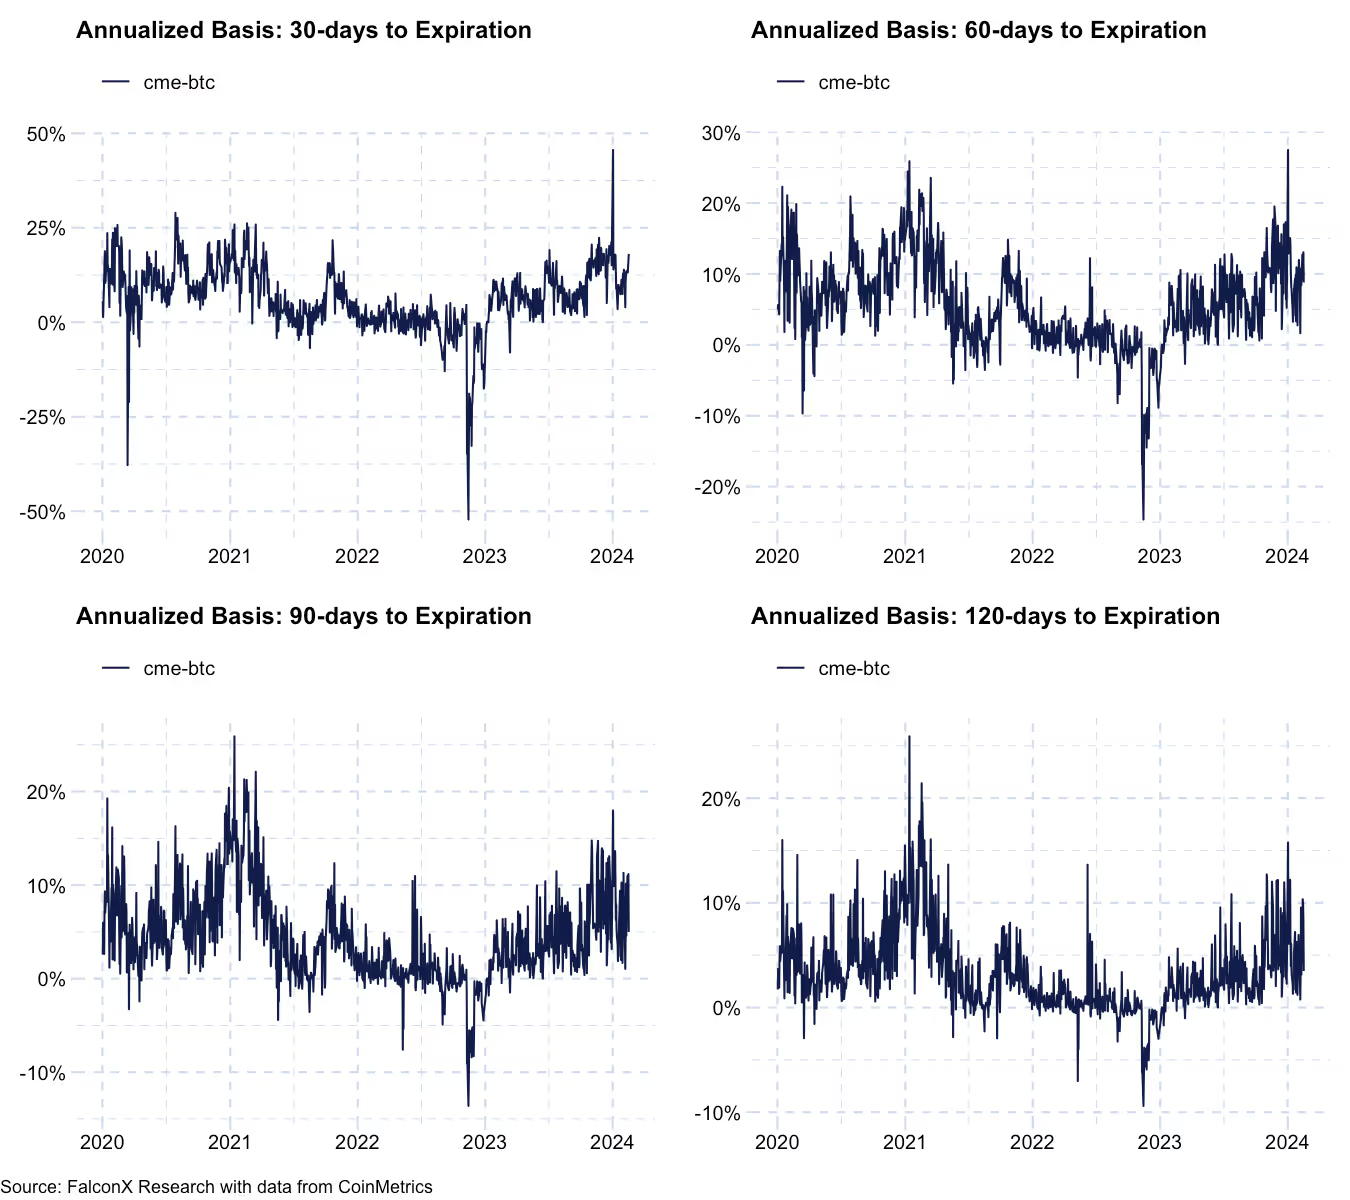
Given that the typical investor who can access the CME tends to be larger U.S.-based institutions, the higher basis indicates that demand for BTC exposure remains heated among this investor persona.
This material is for informational purposes only and is only intended for sophisticated or institutional investors. Neither FalconX Limited, FalconX Bravo, Inc., FalconX Delta, Inc., FalconX Foxtrot Pte Ltd., FalconX Golf Pte Ltd., Solios, Inc., Falcon Labs, Ltd., KestrelX, Ltd., nor Banzai Pipeline Limited (separately and collectively “FalconX”) service retail counterparties, and the information on this website is NOT intended for retail investors. The material published on this website is not (i) an offer, or solicitation of an offer, to invest in, or to buy or sell, any interests or shares, or to participate in any investment or trading strategy, (ii) intended to provide accounting, legal, or tax advice, or investment recommendations, or (iii) an official statement of FalconX or any of its affiliates. Any information contained in this website is not and should not be regarded as investment research, debt research, or derivatives research for the purposes of the rules of the CFTC or any other relevant regulatory body.
Prior to entering into any proposed transaction, recipients should determine, in consultation with their own investment, legal, tax, regulatory, and accounting advisors, the economic risks and merits, as well as the legal, tax, regulatory and accounting characteristics and consequences of the transaction. Pursuant to the Dodd-Frank Act, over-the-counter derivatives are only permitted to be traded by "eligible contract participants" (“ECP”s) as defined under Section 1a(18) of the CEA (7 U.S.C. § 1a(18)). Do not consider derivatives or structured products unless you are an ECP and fully understand and are willing to assume the risks.
Solios, Inc. and FalconX Delta, Inc. are registered as federal money services businesses with FinCEN. FalconX Bravo, Inc. is registered with the U.S. Commodities Futures Trading Commission (CFTC) as a swap dealer and a member of the National Futures Association. FalconX Limited, FalconX Bravo, Inc., FalconX Delta, Inc., Falcon Labs Ltd., and Solios, Inc. are not registered with the Securities & Exchange Commission or the Financial Industry Regulatory Authority. FalconX Golf Pte. Ltd. is not required to be registered or licensed by the Monetary Authority of Singapore (MAS). MAS has granted FalconX Foxtrot Pte. Ltd. a temporary exemption from holding a license under the PSA for the payment services caught under the expanded scope of regulated activities for a specified period. FalconX Limited is a registered Class 3 VFA service provider with the Malta Financial Services Authority under the Virtual Financial Assets Act of 2018. FalconX Limited is licensed to provide the following services to Experienced Investors, Execution of orders on behalf of other persons, Custodian or Nominee Services, and Dealing on own account. FalconX’s complaint policy can be accessed by sending a request to complaints@falconx.io
"FalconX" is a marketing name for FalconX Limited and its affiliates. Availability of products and services is subject to jurisdictional limitations and capabilities of each FalconX entity. For information about which legal entities offer trading products and services, or if you are considering entering into a derivatives transaction, please reach out to your Sales or Trading representative.