3Q26 Crypto Market Review
Crypto markets rebounded in 3Q26 even as spot volumes lagged, while BTC traded increasingly as a debasement hedge alongside gold.

Investing in digital assets or tokenized equities, and their respective derivatives, involves a substantial degree of risk. Market prices can be highly volatile and unpredictable. Movements in the market can result in significant, rapid, and potentially total loss of your invested capital. Before allocating capital, you should carefully evaluate whether such investments align with your financial situation, experience, and risk tolerance. For further information regarding potential risks, please refer to the disclaimer below.
Crypto rebounded in 3Q26. BTC rose 43% to close the quarter around $83.6K, while ETH gained 71% and SOL increased 61%. Several altcoins outperformed, led by ZEC (+260%), UNI (+220%) and NEAR (+200%).
Activity lagged the price recovery. 3Q26 crypto spot volumes declined 59% YoY, while futures volumes fell 38% YoY, with July spot volume the lowest monthly total since October 2023. Positioning, however, rebuilt as futures open interest rose from $53B to $82B over the quarter, partly reflecting higher prices. Furthermore, spot BTC ETFs took in $6.3B after $4.9B of outflows in 2Q26, alongside $11.7B of inflows into gold ETFs as BTC's correlation with gold climbed toward the top of its historical range. Volumes picked up through August and September as the rally broadened.
The key catalyst was the US Treasury’s mid-August announcement that it would ramp up long-dated bond purchases, sparking debasement fears. The rally was supported in part by significant short liquidations, comparable to the reverse of the long liquidations that occurred on October 10, 2025, which marked the start of crypto’s bear market.
Spot Volumes Lag the Price Rebound
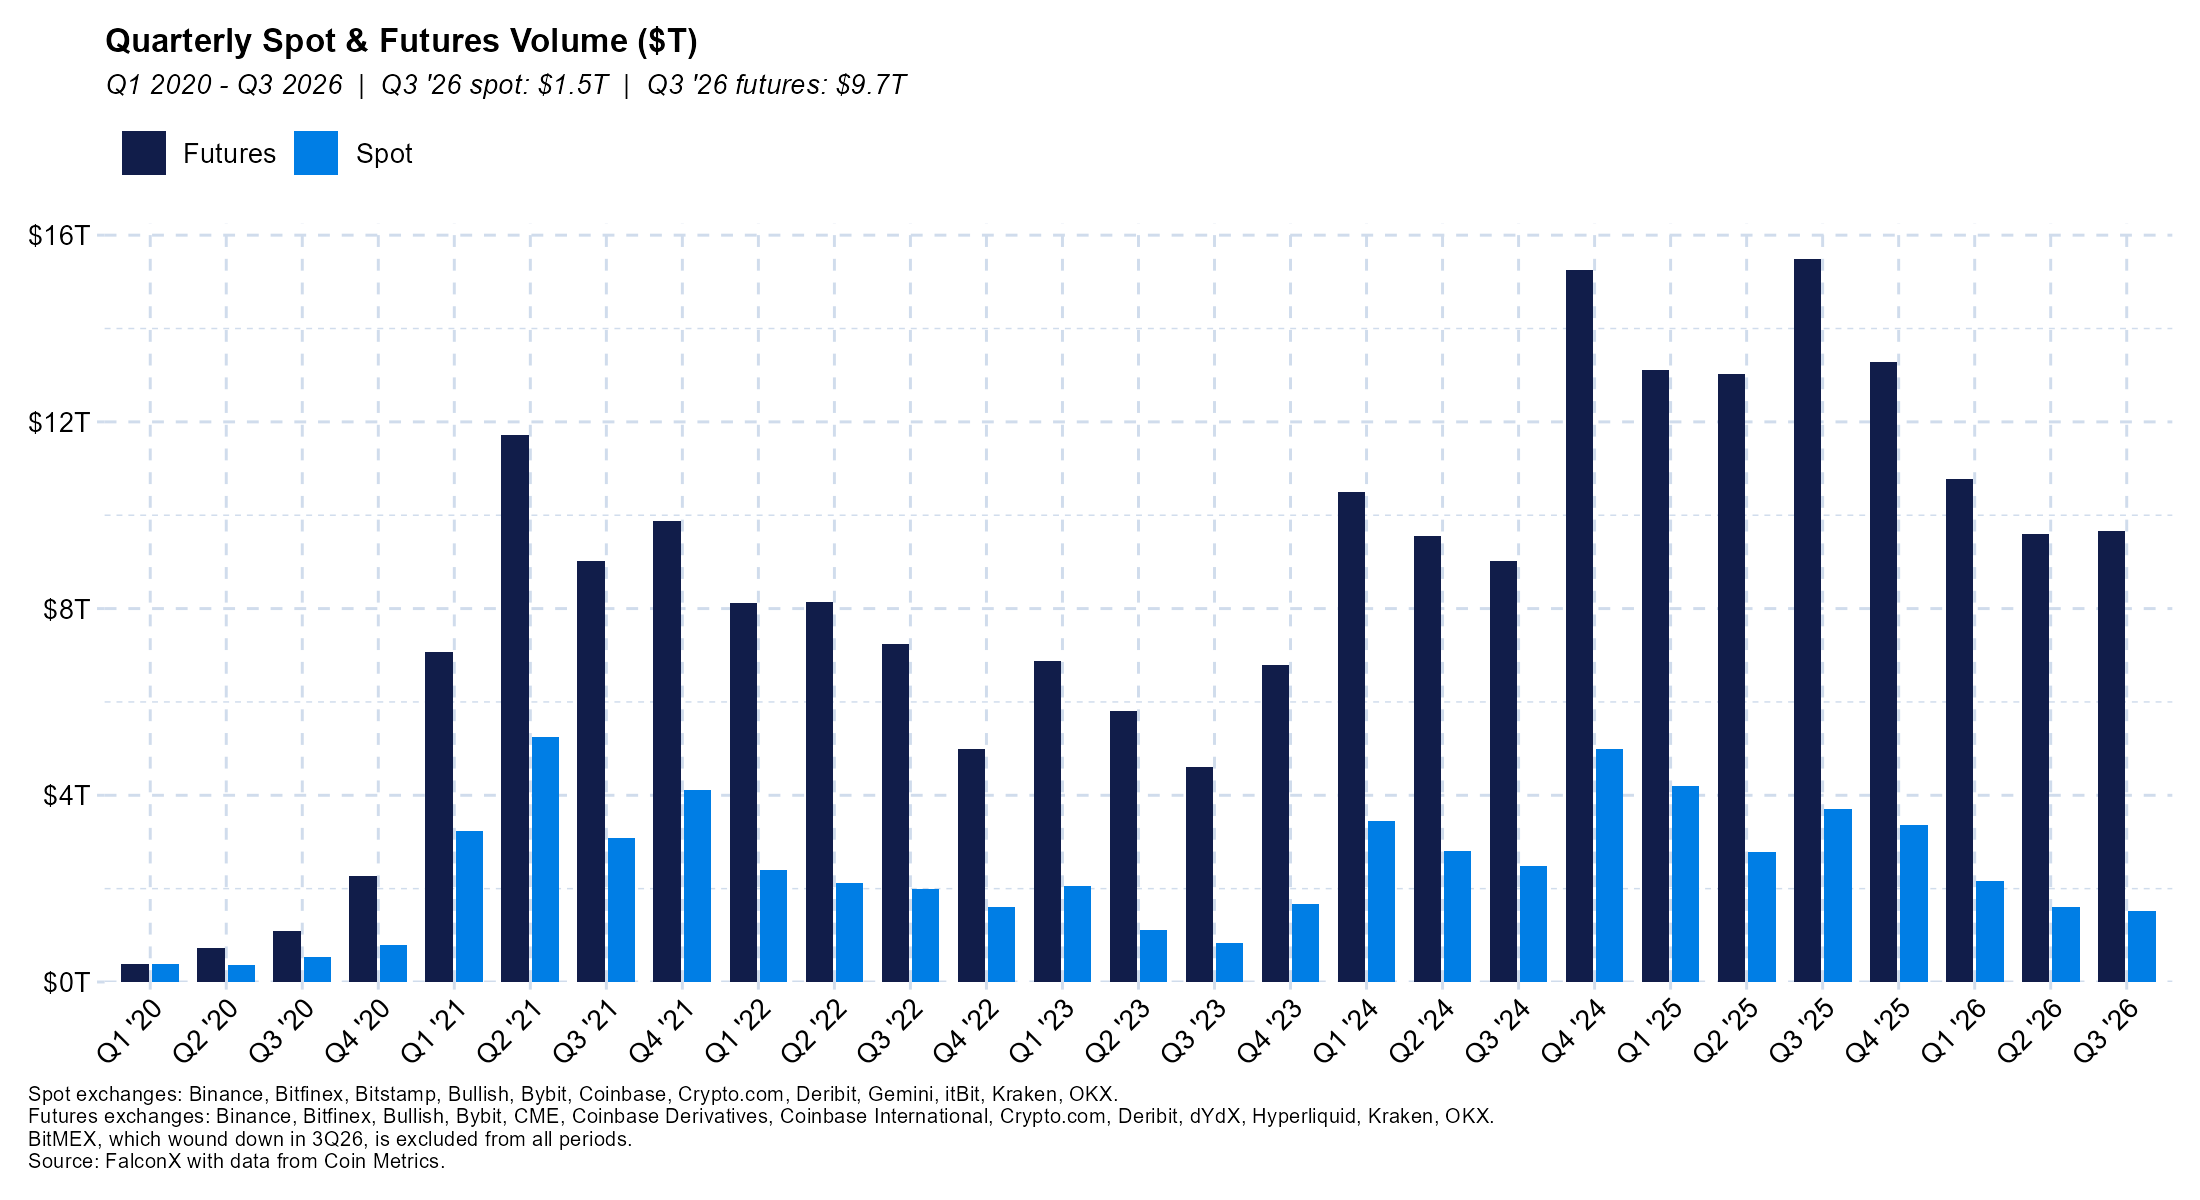
Spot volume across a set of 12 leading exchanges1 totaled $1.5T in 3Q26, -6% from the prior quarter and -59% from a year ago, per data from Coin Metrics, the weakest quarter since 3Q23 ($0.8T in spot volumes). Within the quarter, July volumes of $393B were the lowest monthly total since October 2023, before recovering to $483B in August and $638B in September (+62% vs. July). September spot volumes were still 56% below October 2025 volumes ($1.5T), when crypto markets were near their cycle highs.
Futures volume, across a set of 13 venues2, totaled $9.7T, +1% QoQ and -38% from a year ago, with September ($3.65T) the most active month of the quarter.3
Through the first 5 days of October, average daily spot and futures volumes were running 12% and 19% below their September averages, respectively, as crypto prices consolidated.
Futures Open Interest Rebuilds
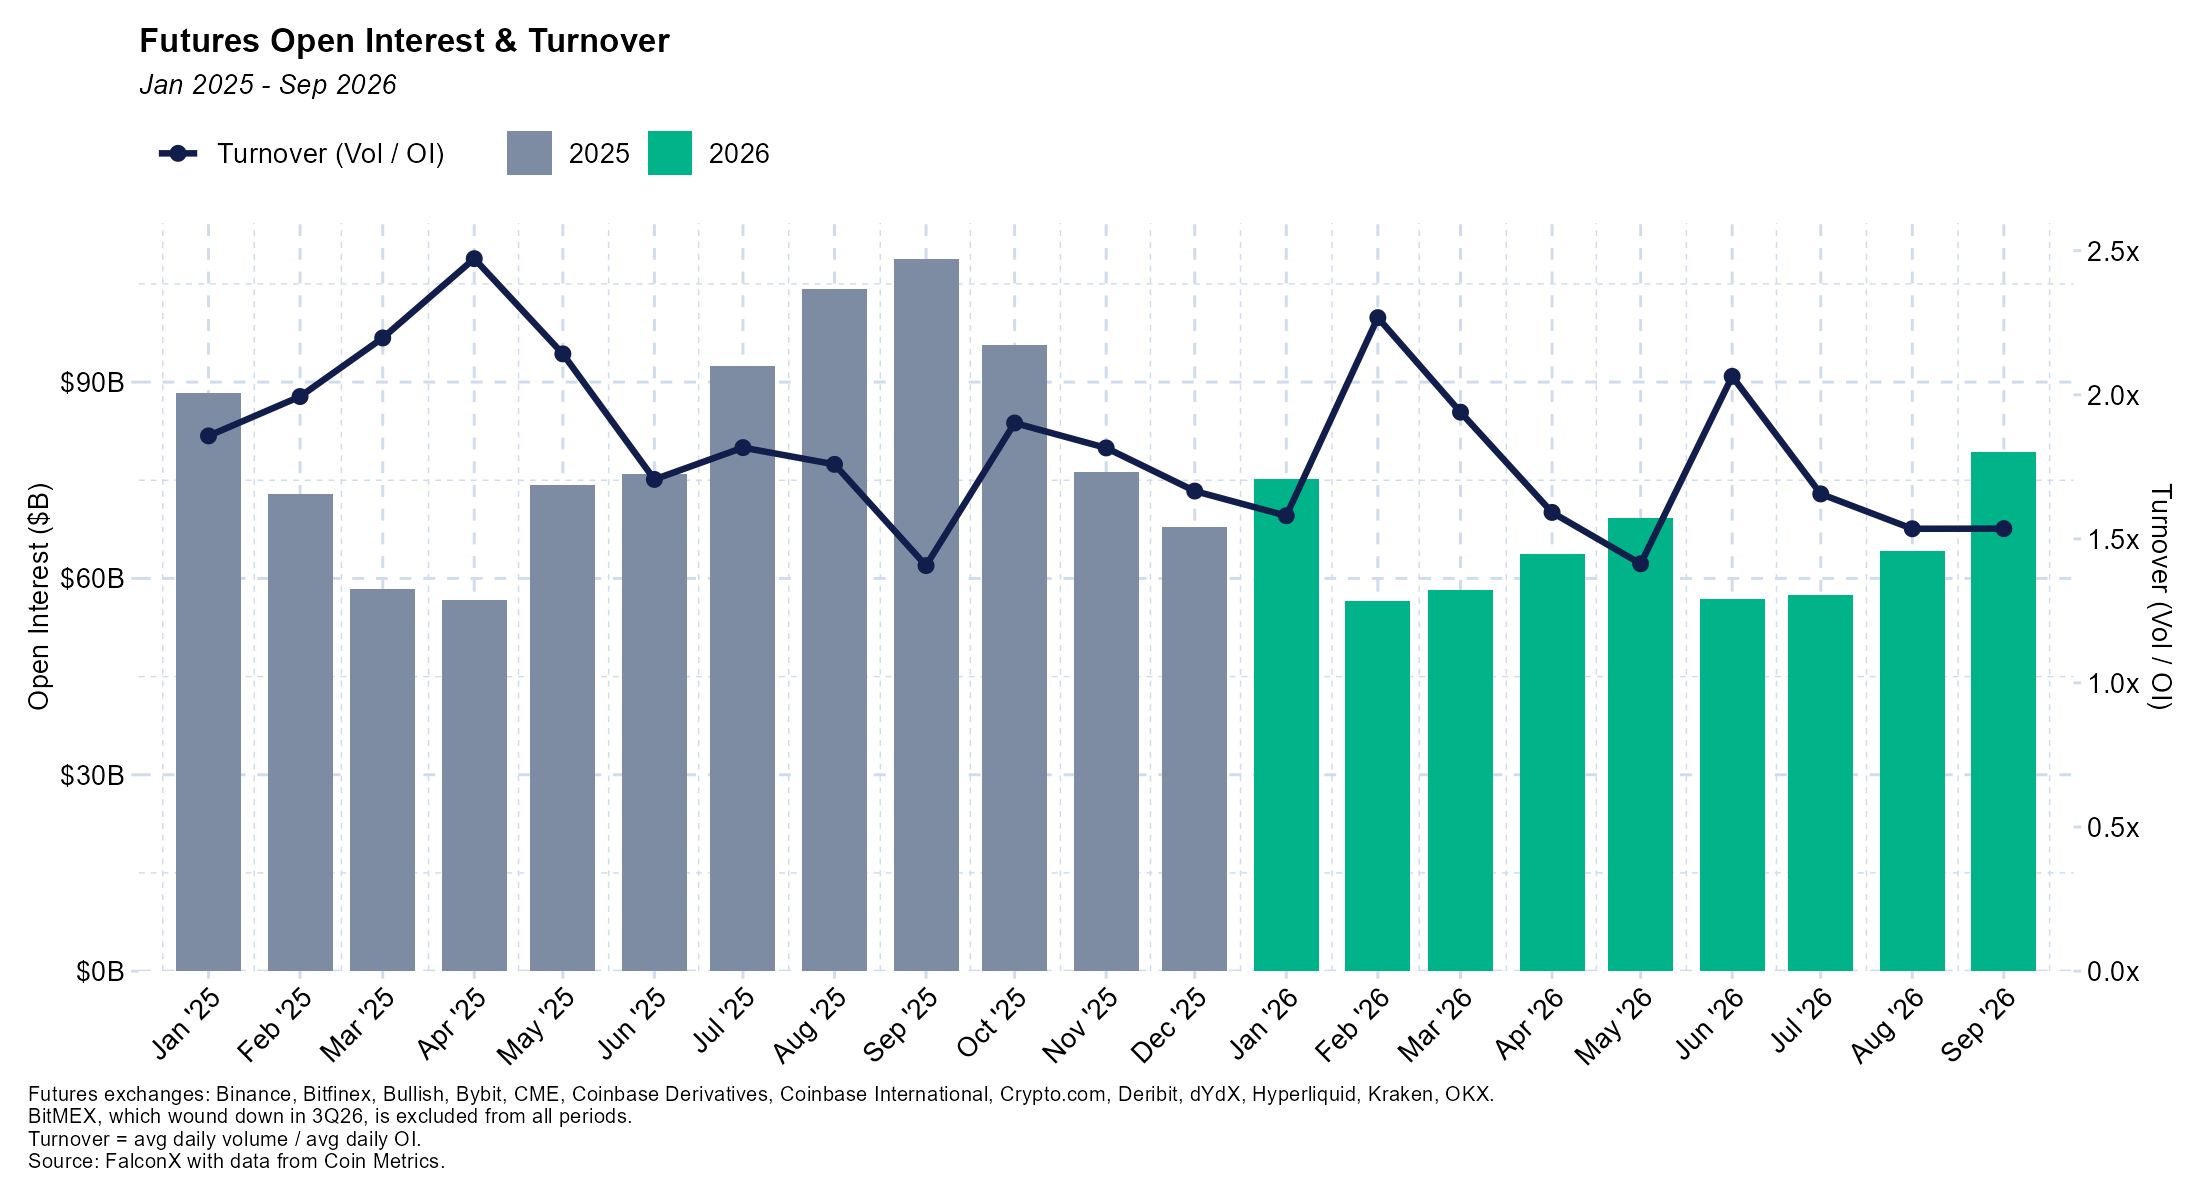
Aggregate futures open interest (OI) across the same set of venues ended September at $82.1B, up 55% from $53.0B at the end of 2Q26 and the highest quarter-end level since 3Q25. OI remains 32% below its October 2025 peak ($121.6B). Much of the increase reflects higher crypto prices (BTC +43%, ETH +71%), as discussed below. The increase in futures positioning came late in the quarter: OI stood around $60B in mid-August before climbing to a quarterly high of $90.8B on September 23.
By venue, Hyperliquid OI nearly doubled (+95% to $12.3B), approaching CME ($13.4B, +72%), while Binance ($29.9B, +49%) and Bybit ($13.0B, +49%) rose roughly in line with prices.
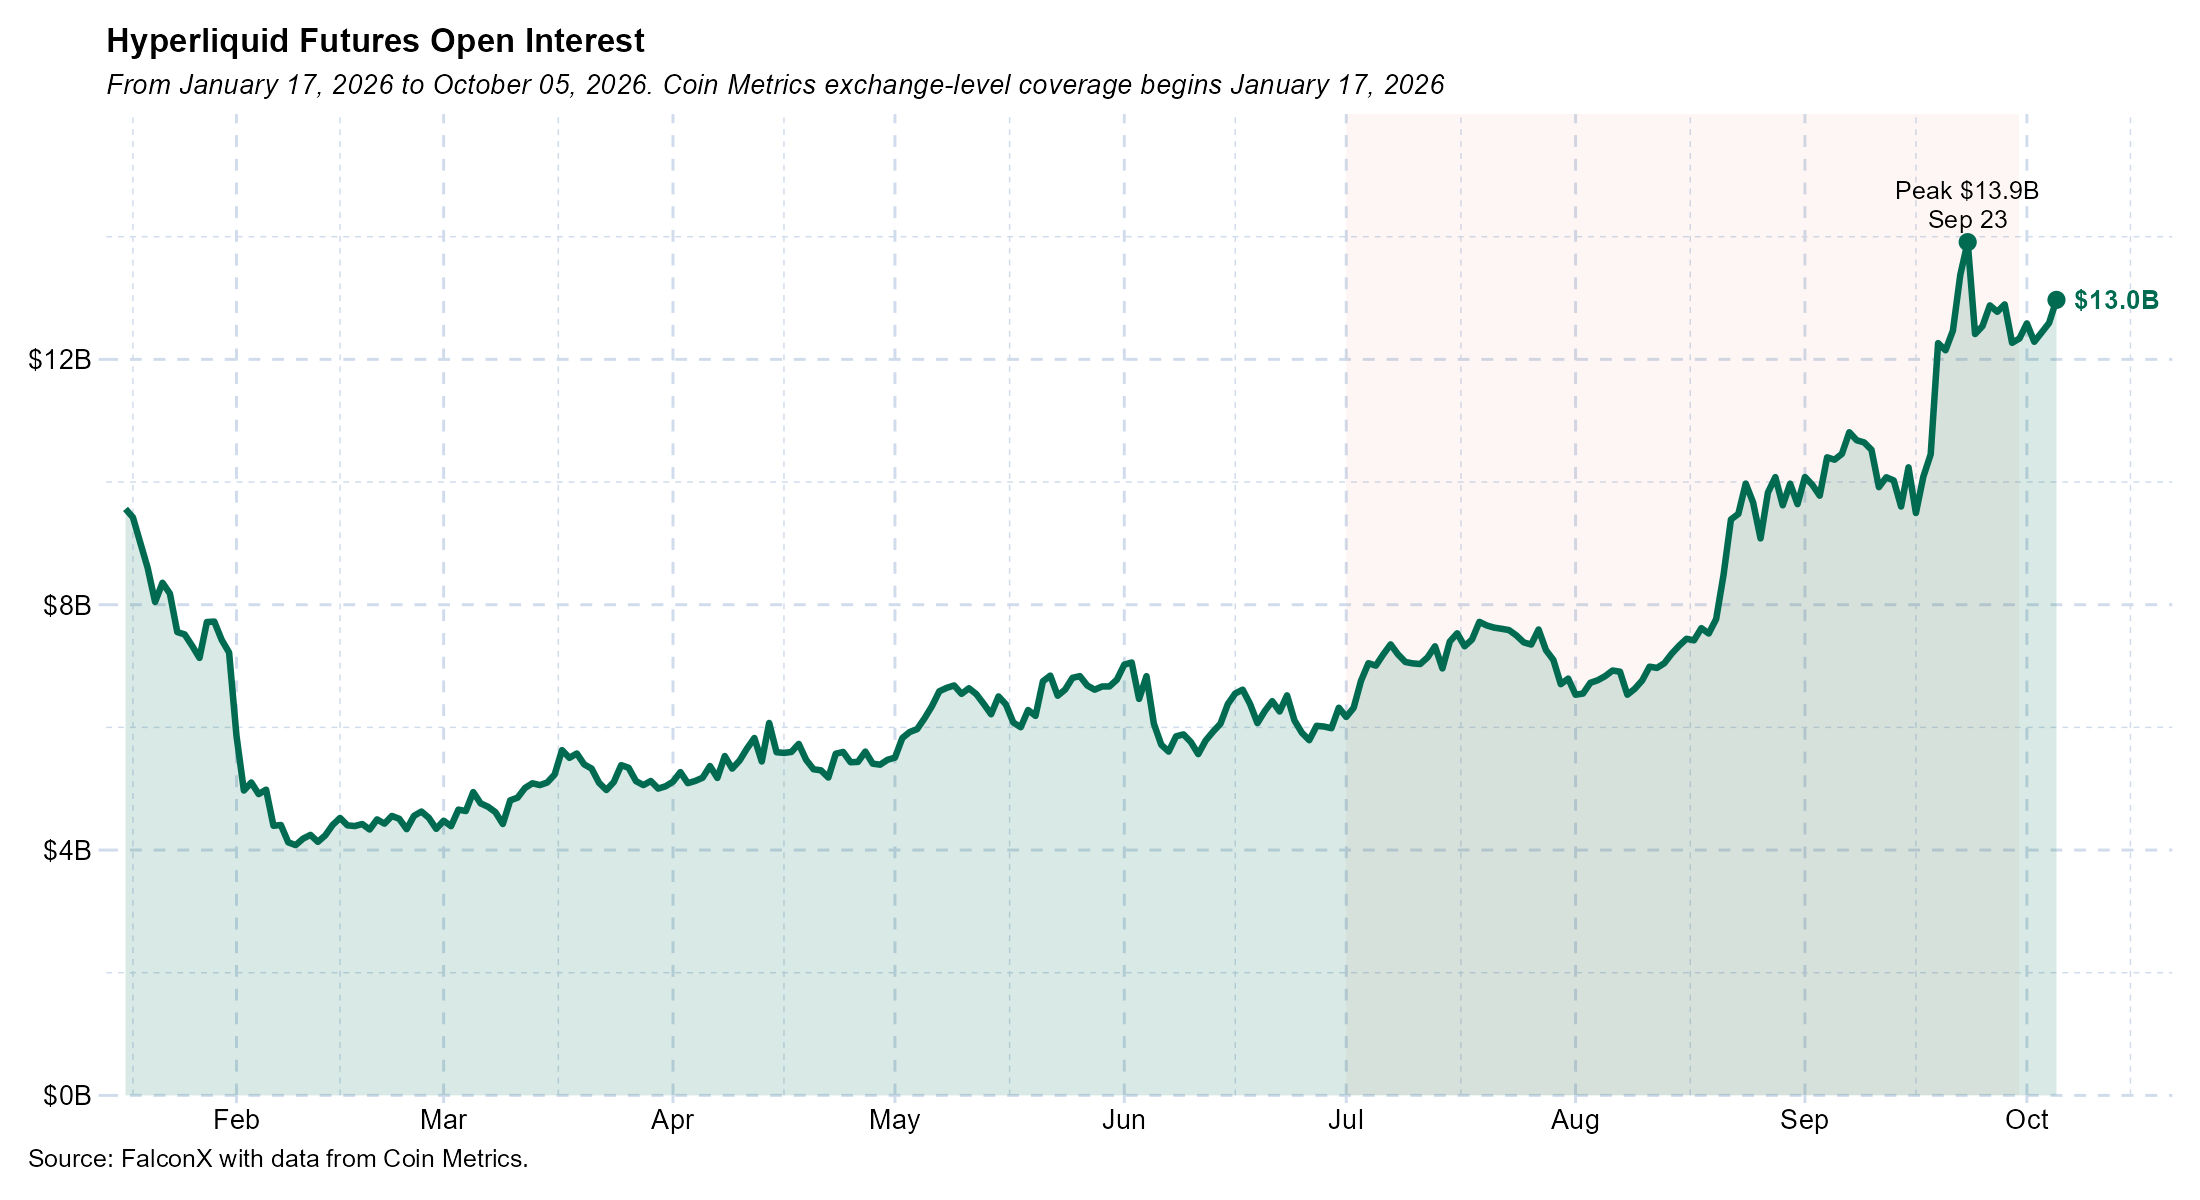
Hyperliquid futures OI reached $13.9B on September 23, setting a new ATH per Coin Metrics data, and ended the quarter at $12.3B, up from $6.3B at the end of June. OI stood at $13.0B as of October 5.
The turnover ratio (volume / OI) was 1.6x in the quarter, compared with 1.7x in 2Q26 (restated), as OI rose faster than trading activity. Average daily OI ran ~$58B in July, ~$64B in August and ~$79B in September; monthly turnover moved 1.7x / 1.5x / 1.5x.
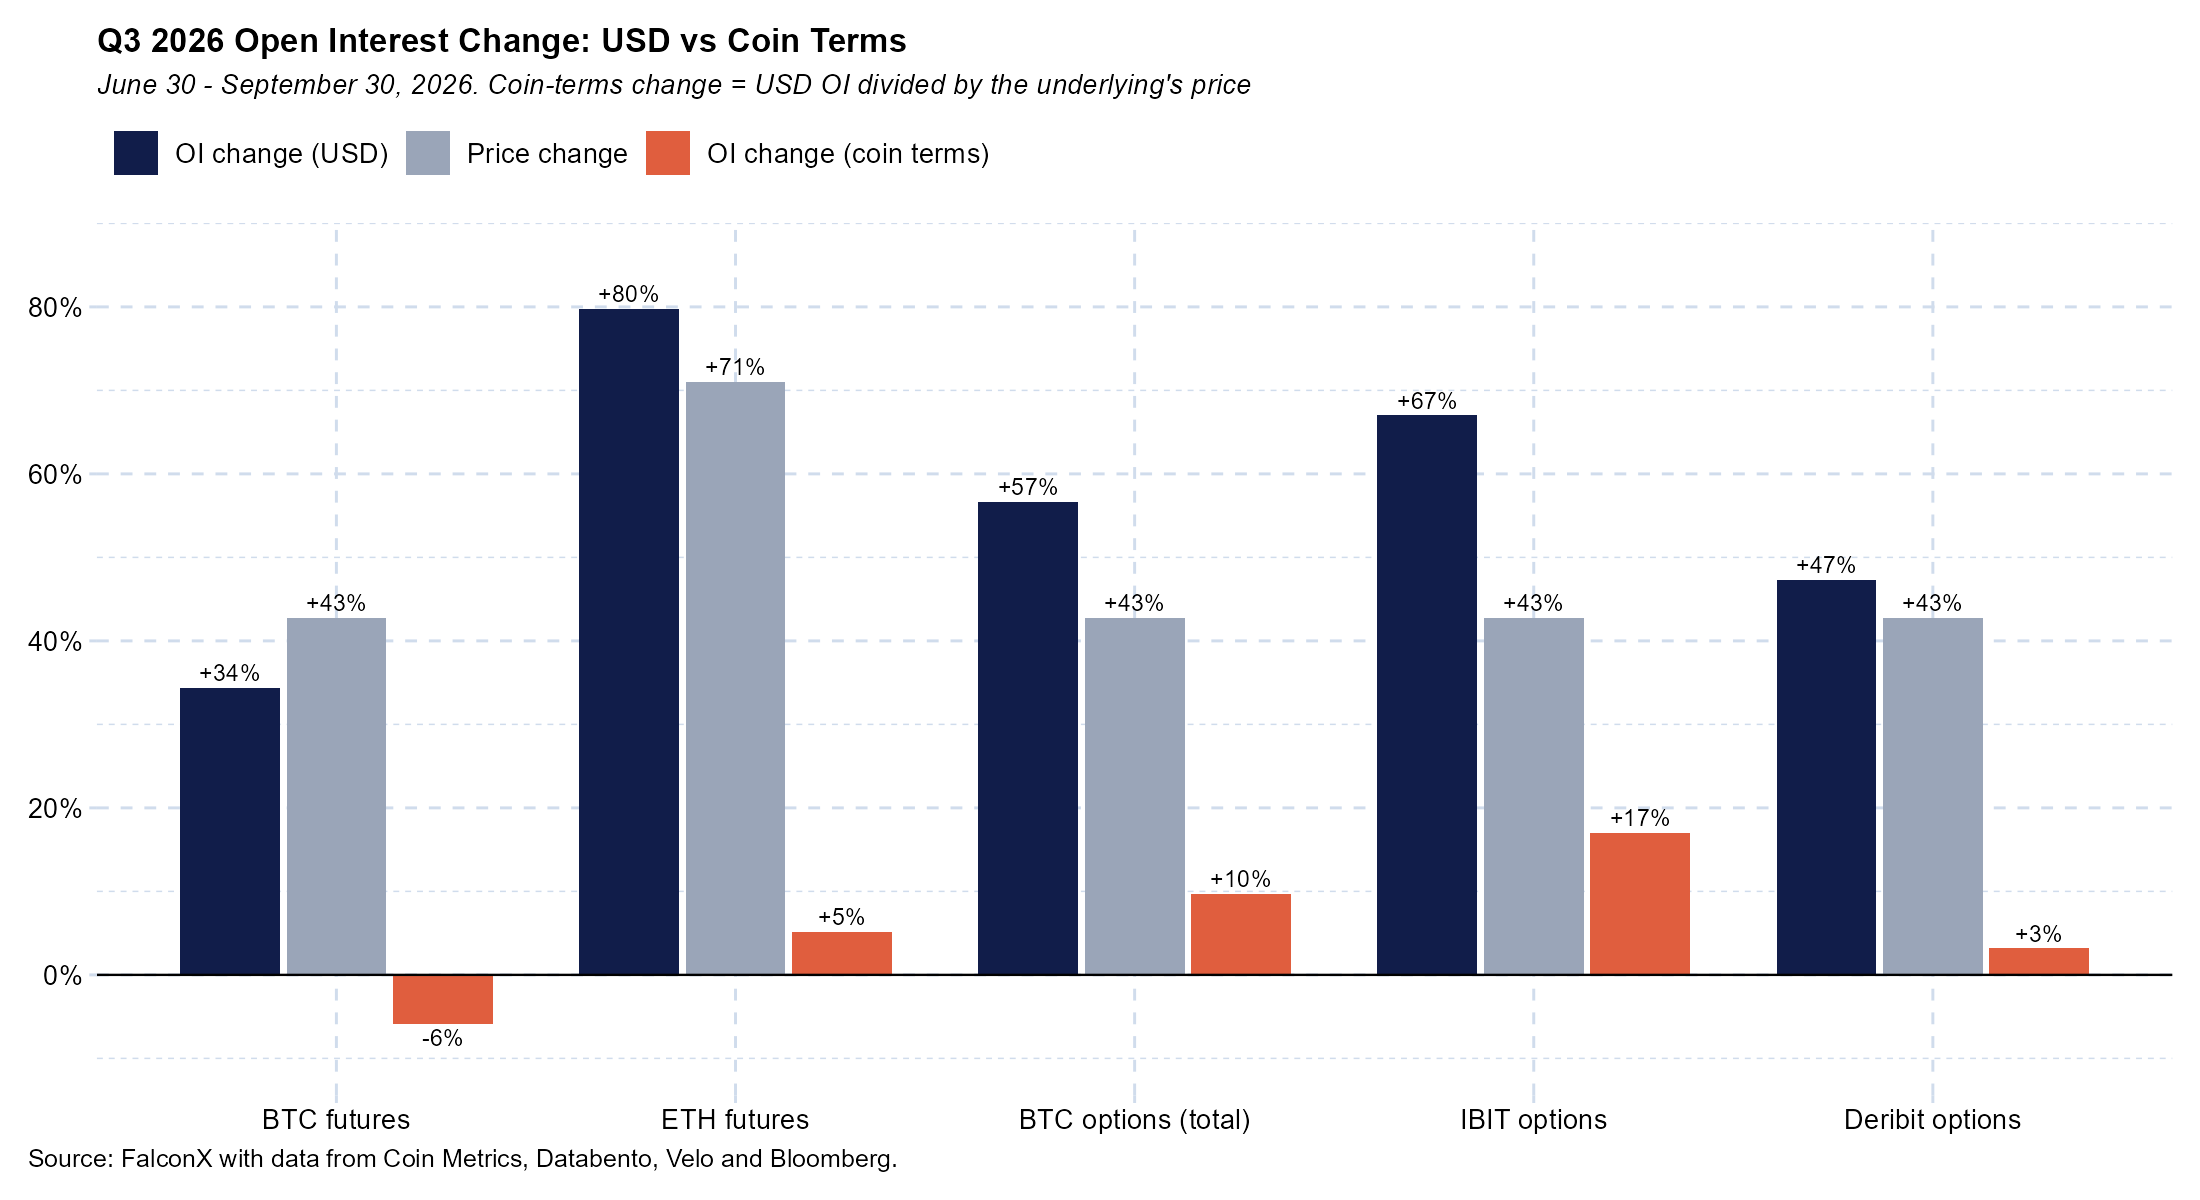
The futures rebuild was largely mark-to-market when adjusting for price. In BTC terms, BTC futures OI across the 13 venues fell 6% over the quarter, while ETH futures OI rose 5% in ETH terms. The larger contribution to the overall increase came from other assets, where futures OI rose 70% in USD terms alongside the altcoin rally. Options showed modestly more conviction: BTC options OI across IBIT, Deribit and CME rose 10% in BTC terms, led by IBIT (+17%).
BTC Options OI Recovers
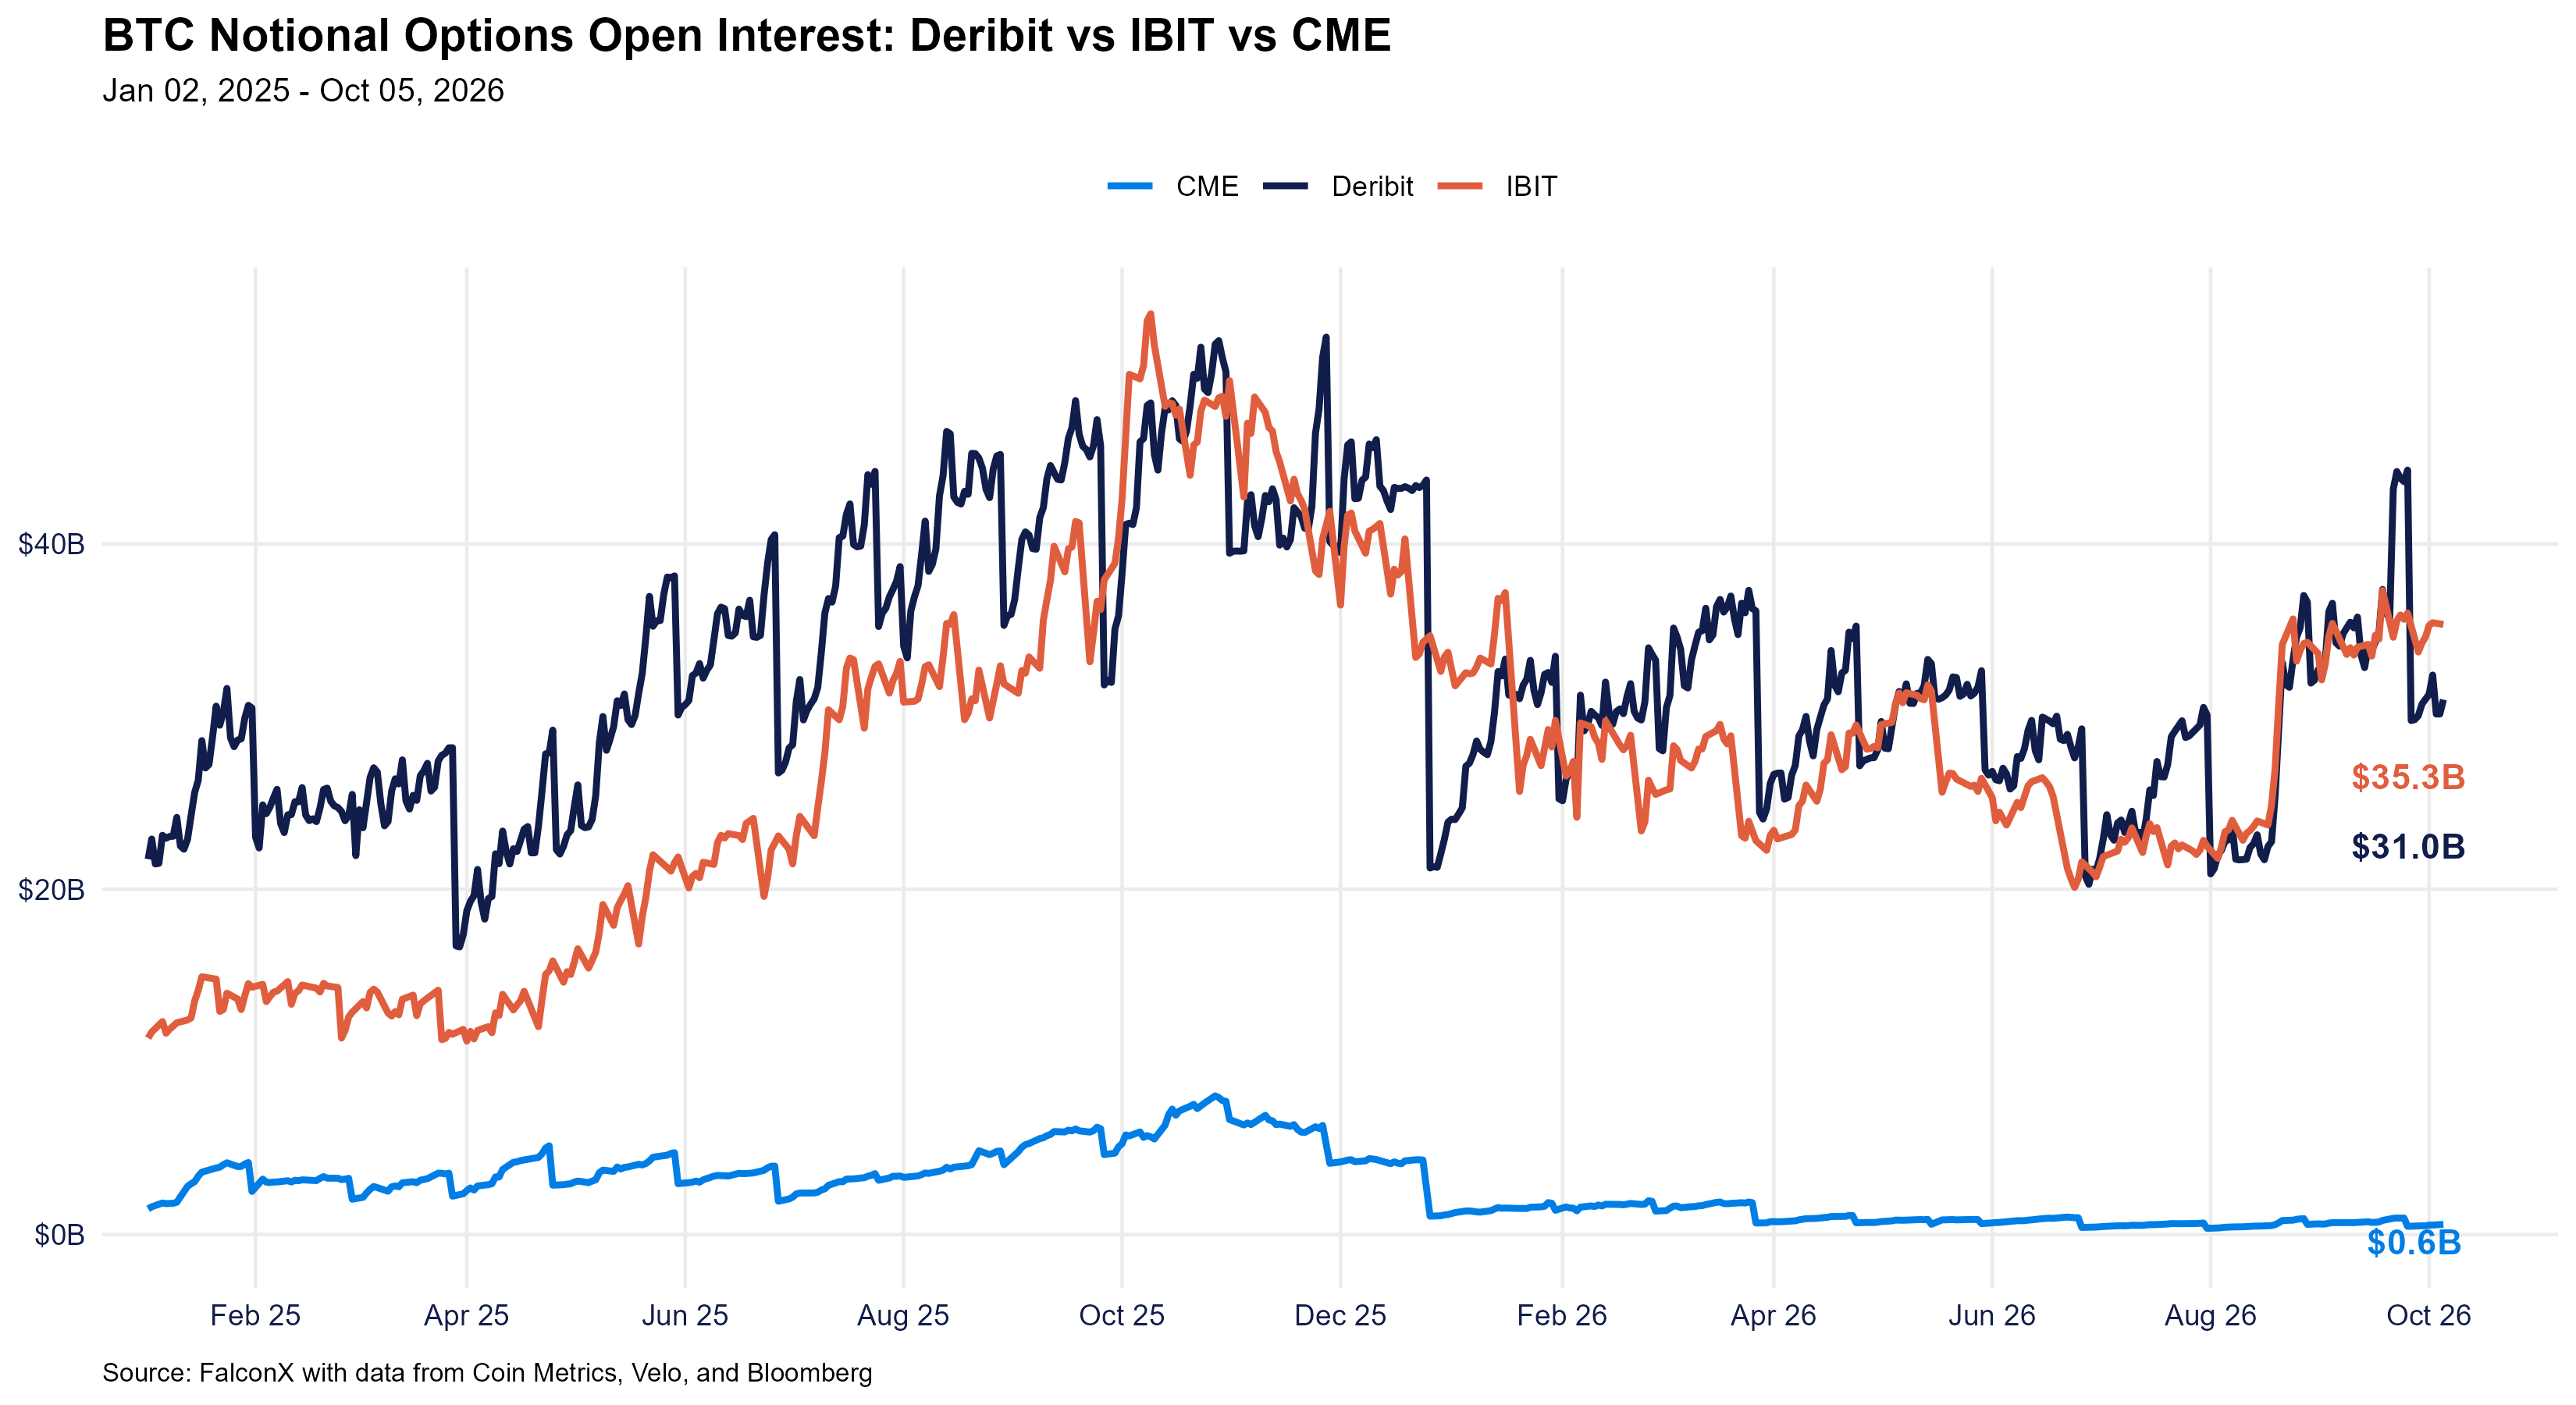
BTC notional options open interest recovered alongside price. As of September 30, 2026, IBIT BTC notional OI totaled $34.6B vs. Deribit's $31.0B, compared with $20.7B and $21.1B, respectively, at the end of 2Q26, leaving IBIT as the largest venue at quarter-end. CME BTC options OI stood at $0.5B. Combined across the three major venues, BTC notional options OI stood at roughly $66B, up from ~$42B at the end of 2Q26.
The quarter-end ranking reflects the venues' different expiry structures. Deribit's OI is concentrated in its quarterly contracts: the September 25 expiry alone accounted for $14-16B, or roughly 35-45% of Deribit's BTC options OI, in the two weeks before it settled. Deribit OI climbed to a pre-expiry high of $44.2B on September 22, buoyed by new positioning in the October 30 monthly expiry (whose OI more than doubled to $8.8B on September 21), before falling to ~$30B once the quarterly contracts rolled off. IBIT's OI, by contrast, is spread across monthly and longer-dated expiries. Its September 18 expiry reduced contract OI by 13% (-7% in notional terms), and IBIT notional OI has held around $35B since. As of October 5, IBIT stood at $35.3B vs. Deribit's $31.0B.
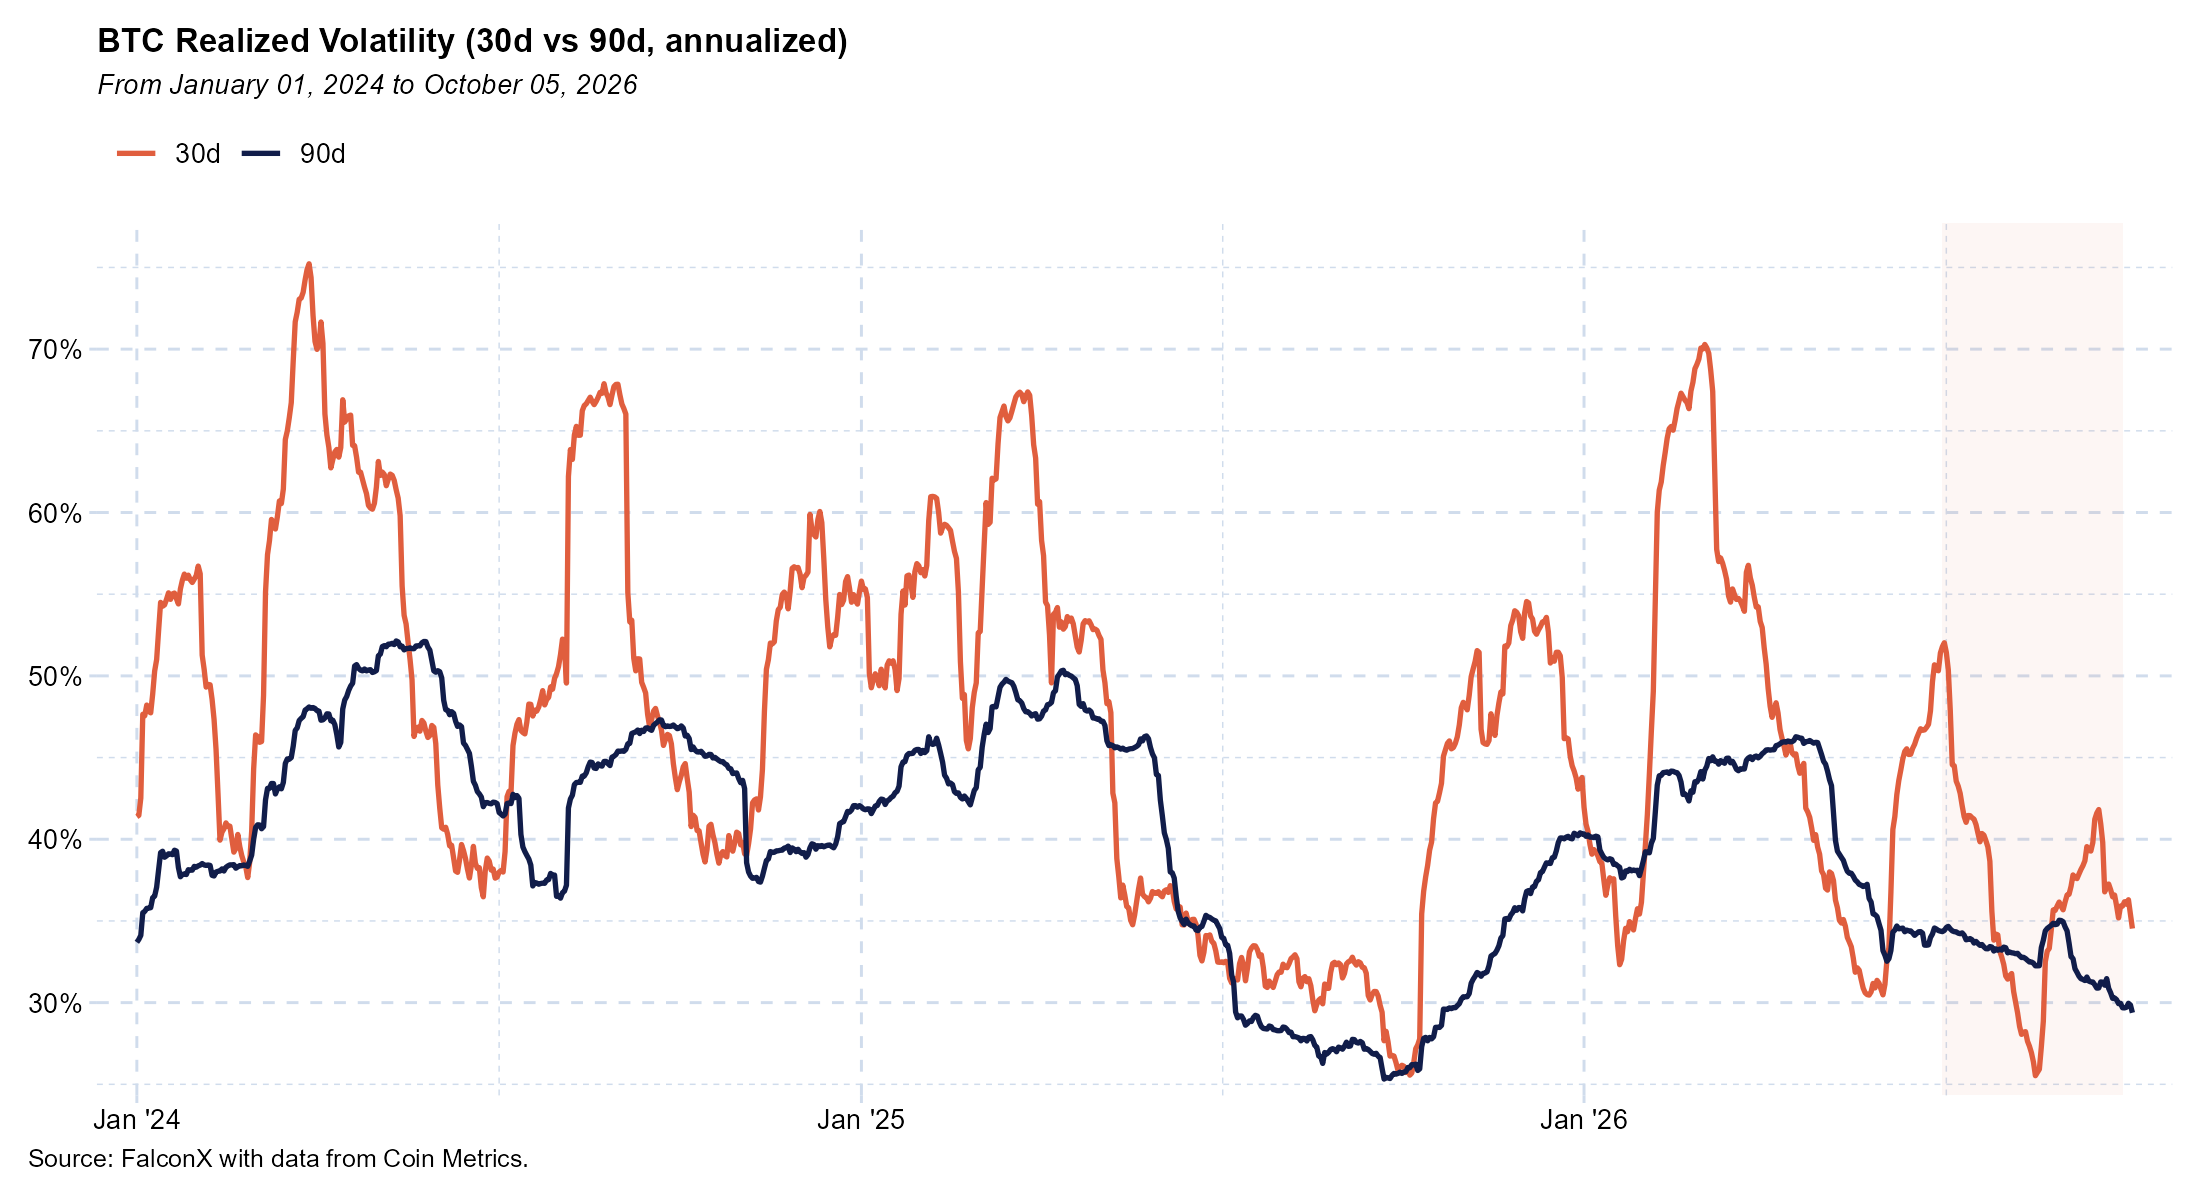
BTC realized volatility compressed into the August breakout. 30D realized vol fell from a July average of 42% to 26% on August 17, its lowest level of the quarter, before BTC rallied 21% in four days to $78K on August 21 amid record short liquidations. 30D and 90D realized vol ended September at 36% and 30%, respectively, down from 51% and 34% at the end of June.
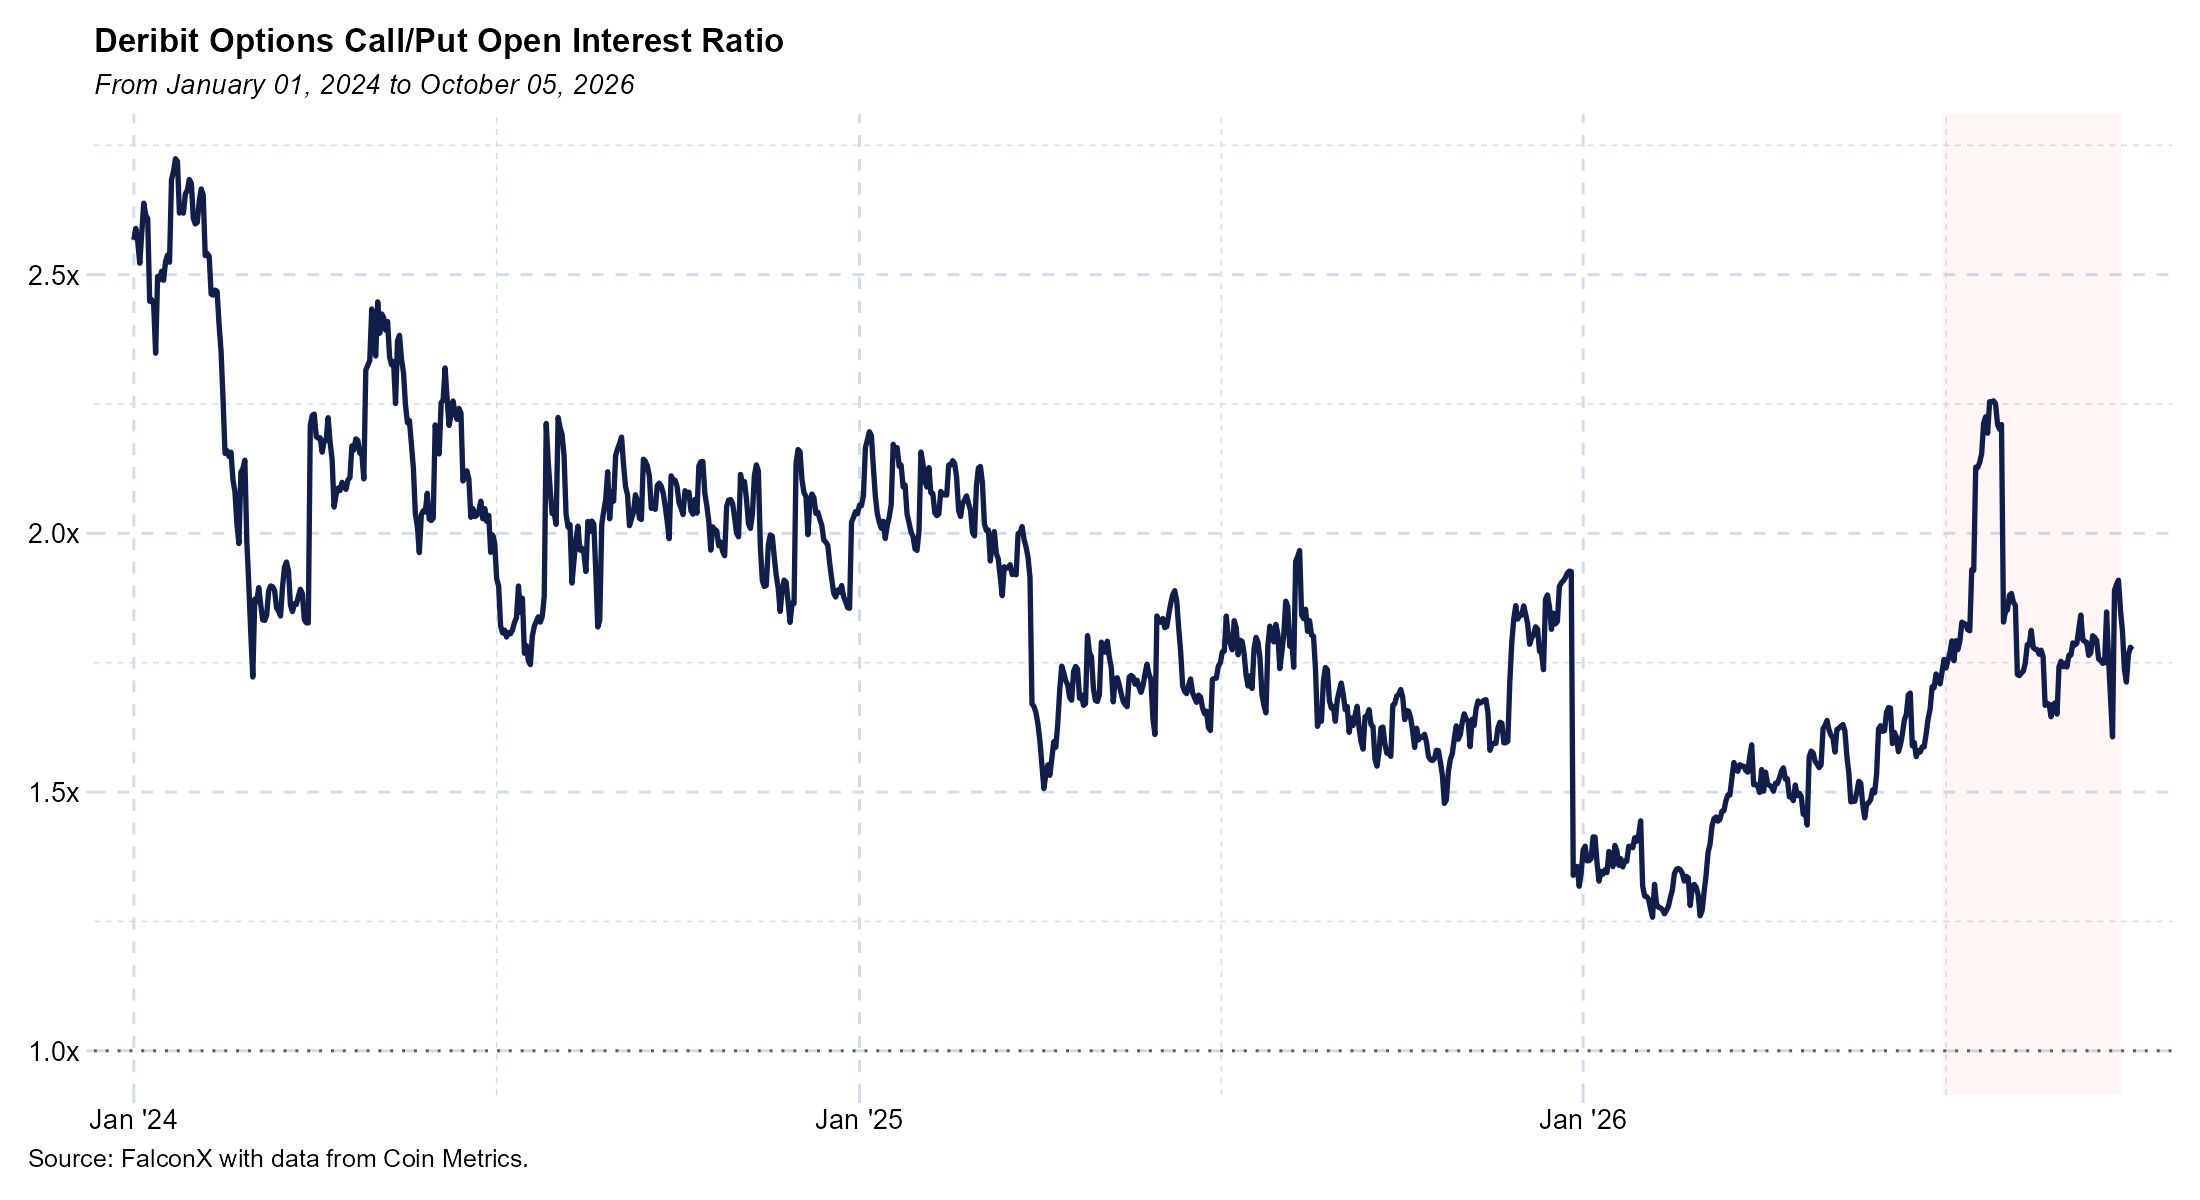
On Deribit, call OI grew faster than put OI over the quarter (+50% vs. +42%), lifting the call/put open interest ratio from 1.71 to 1.81. The ratio peaked at 2.26 on July 27, suggesting traders may have reached for upside exposure earlier in the quarter, though the ratio later normalized.
BTC ETF Flows Turn Positive YTD
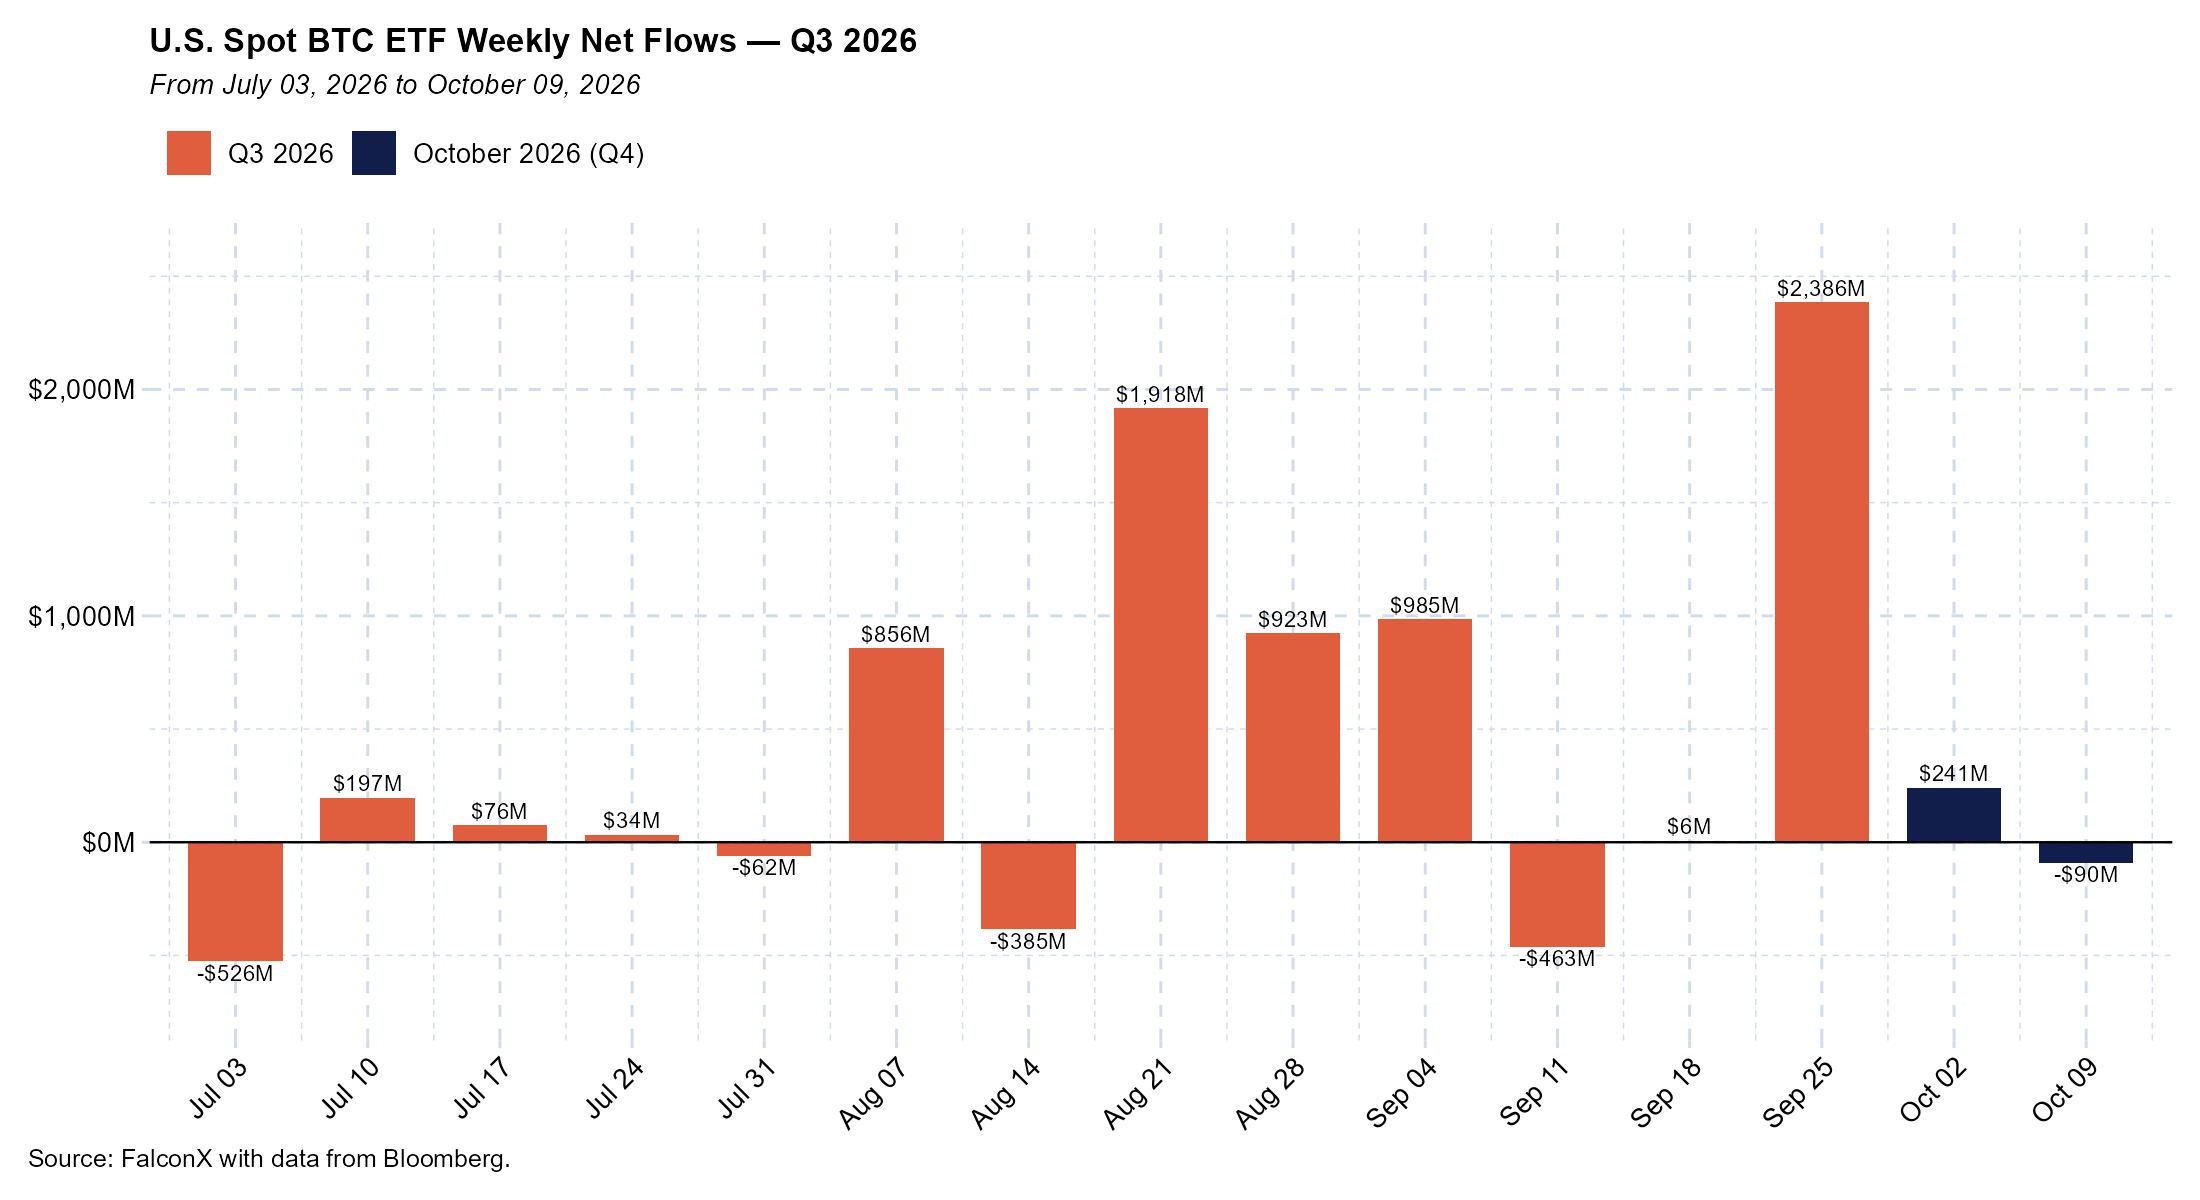
Spot BTC ETF flows reversed in the quarter, with net inflows of $6.3B after $4.9B of net outflows in 2Q26, bringing YTD flows back to +$0.9B. Inflows were concentrated in August (+$3.5B) and September (+$2.6B), after a roughly flat July (+$0.2B), coinciding with the late-quarter rally.
BTC and Gold ETF Flows Move Together
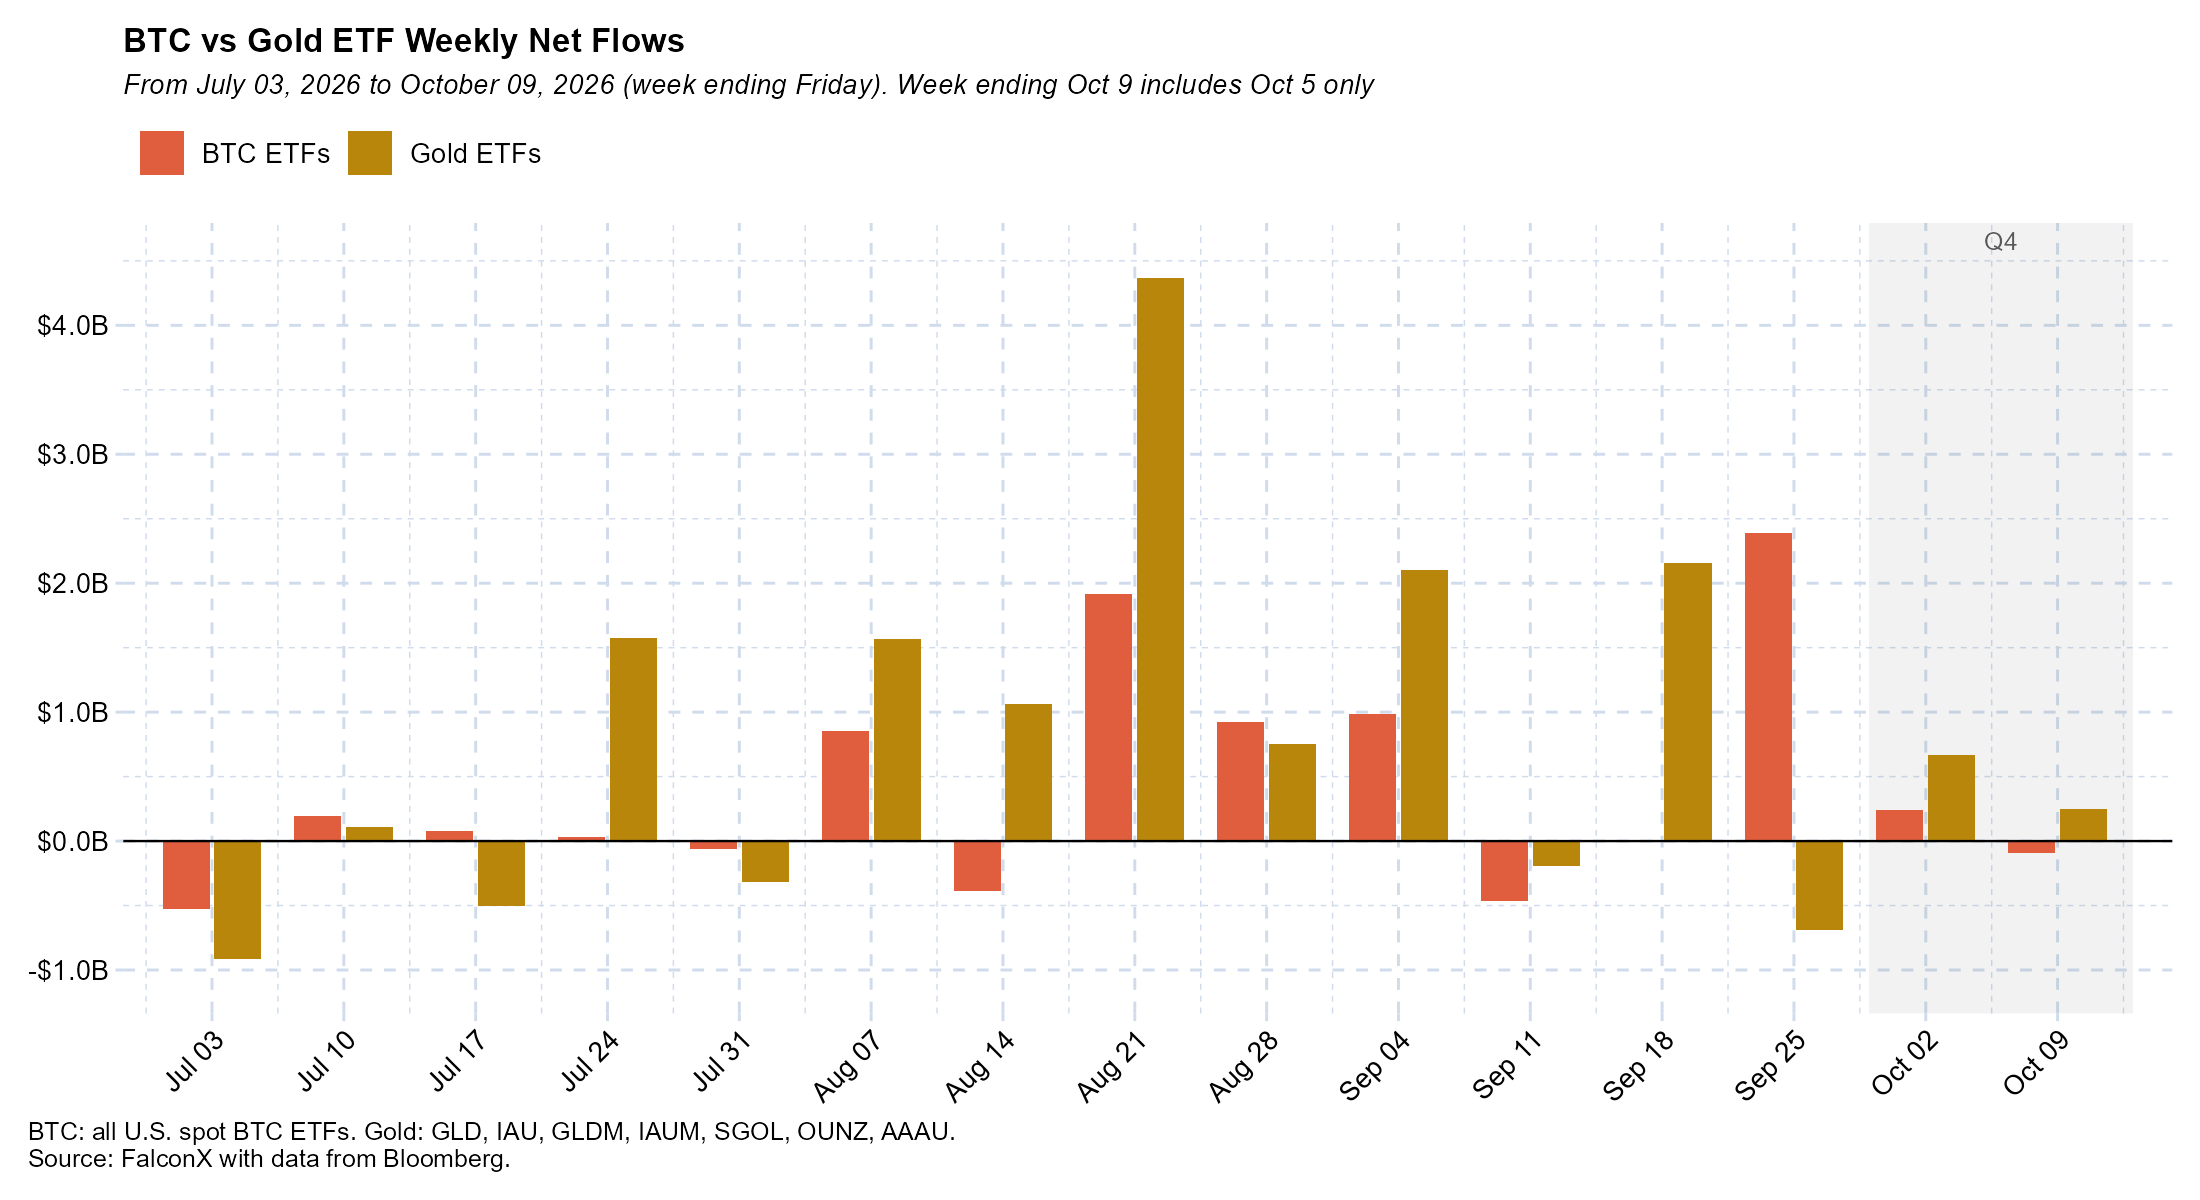
BTC ETF inflows coincided with a return of demand for gold ETFs. U.S. gold ETFs4 took in $11.7B in 3Q26, led by GLD ($7.2B), after $5.5B of outflows in 2Q26, per data from Bloomberg. Cumulative YTD gold ETF flows recovered from −$9.0B on July 17 to +$3.9B at quarter-end, while BTC ETFs moved back to +$0.9B YTD. Gold ETFs' strongest week of the quarter ($4.4B of inflows for the week ending August 21) was also BTC ETFs' second-largest ($1.9B inflows) in the period. Relative to assets at the start of the quarter, BTC ETF inflows (8.9% of AUM) were nearly twice as large as gold's (5.0%). As of October 5, YTD flows stood at +$4.3B for gold ETFs and +$1.1B for BTC ETFs.
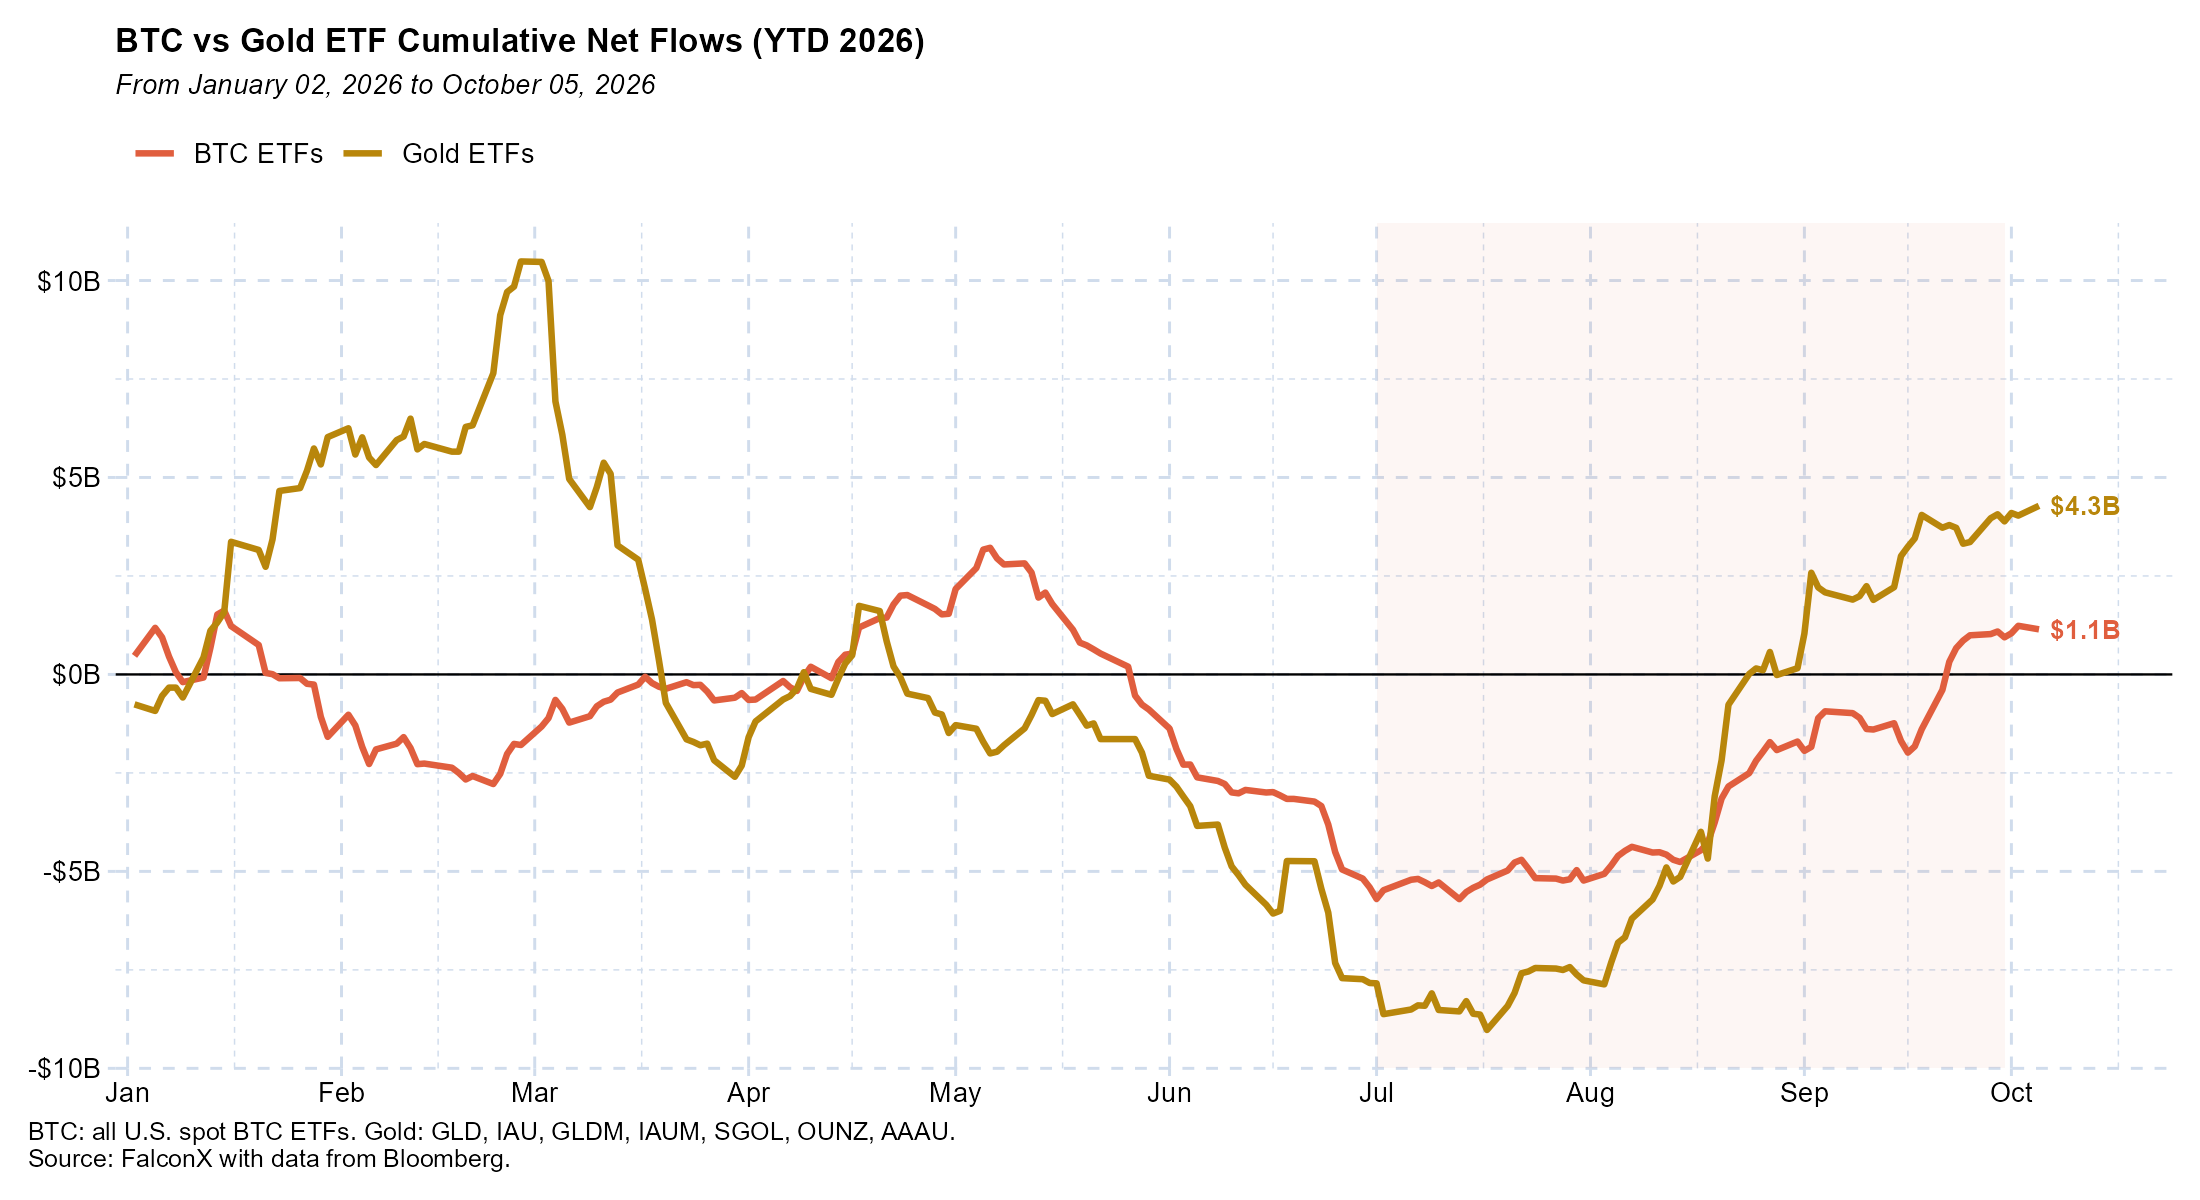
Flows also moved in step. BTC and gold ETF flows moved in the same direction in 10 of 13 weeks in 3Q26 (77%), versus 46% of weeks in 1H26, 58% in 2025 and 51% in 2024.
Prices moved together too. BTC's 90-day correlation with gold rose from 0.32 at the end of June to 0.51 at the end of September, per data from Bloomberg, and peaked at 0.59 on September 10, around its highest level ever. As of October 5, it stood at 0.51, the 98th percentile of its history. Together with the parallel ETF flows, this suggests BTC traded more as a debasement hedge alongside gold during the quarter's rally.
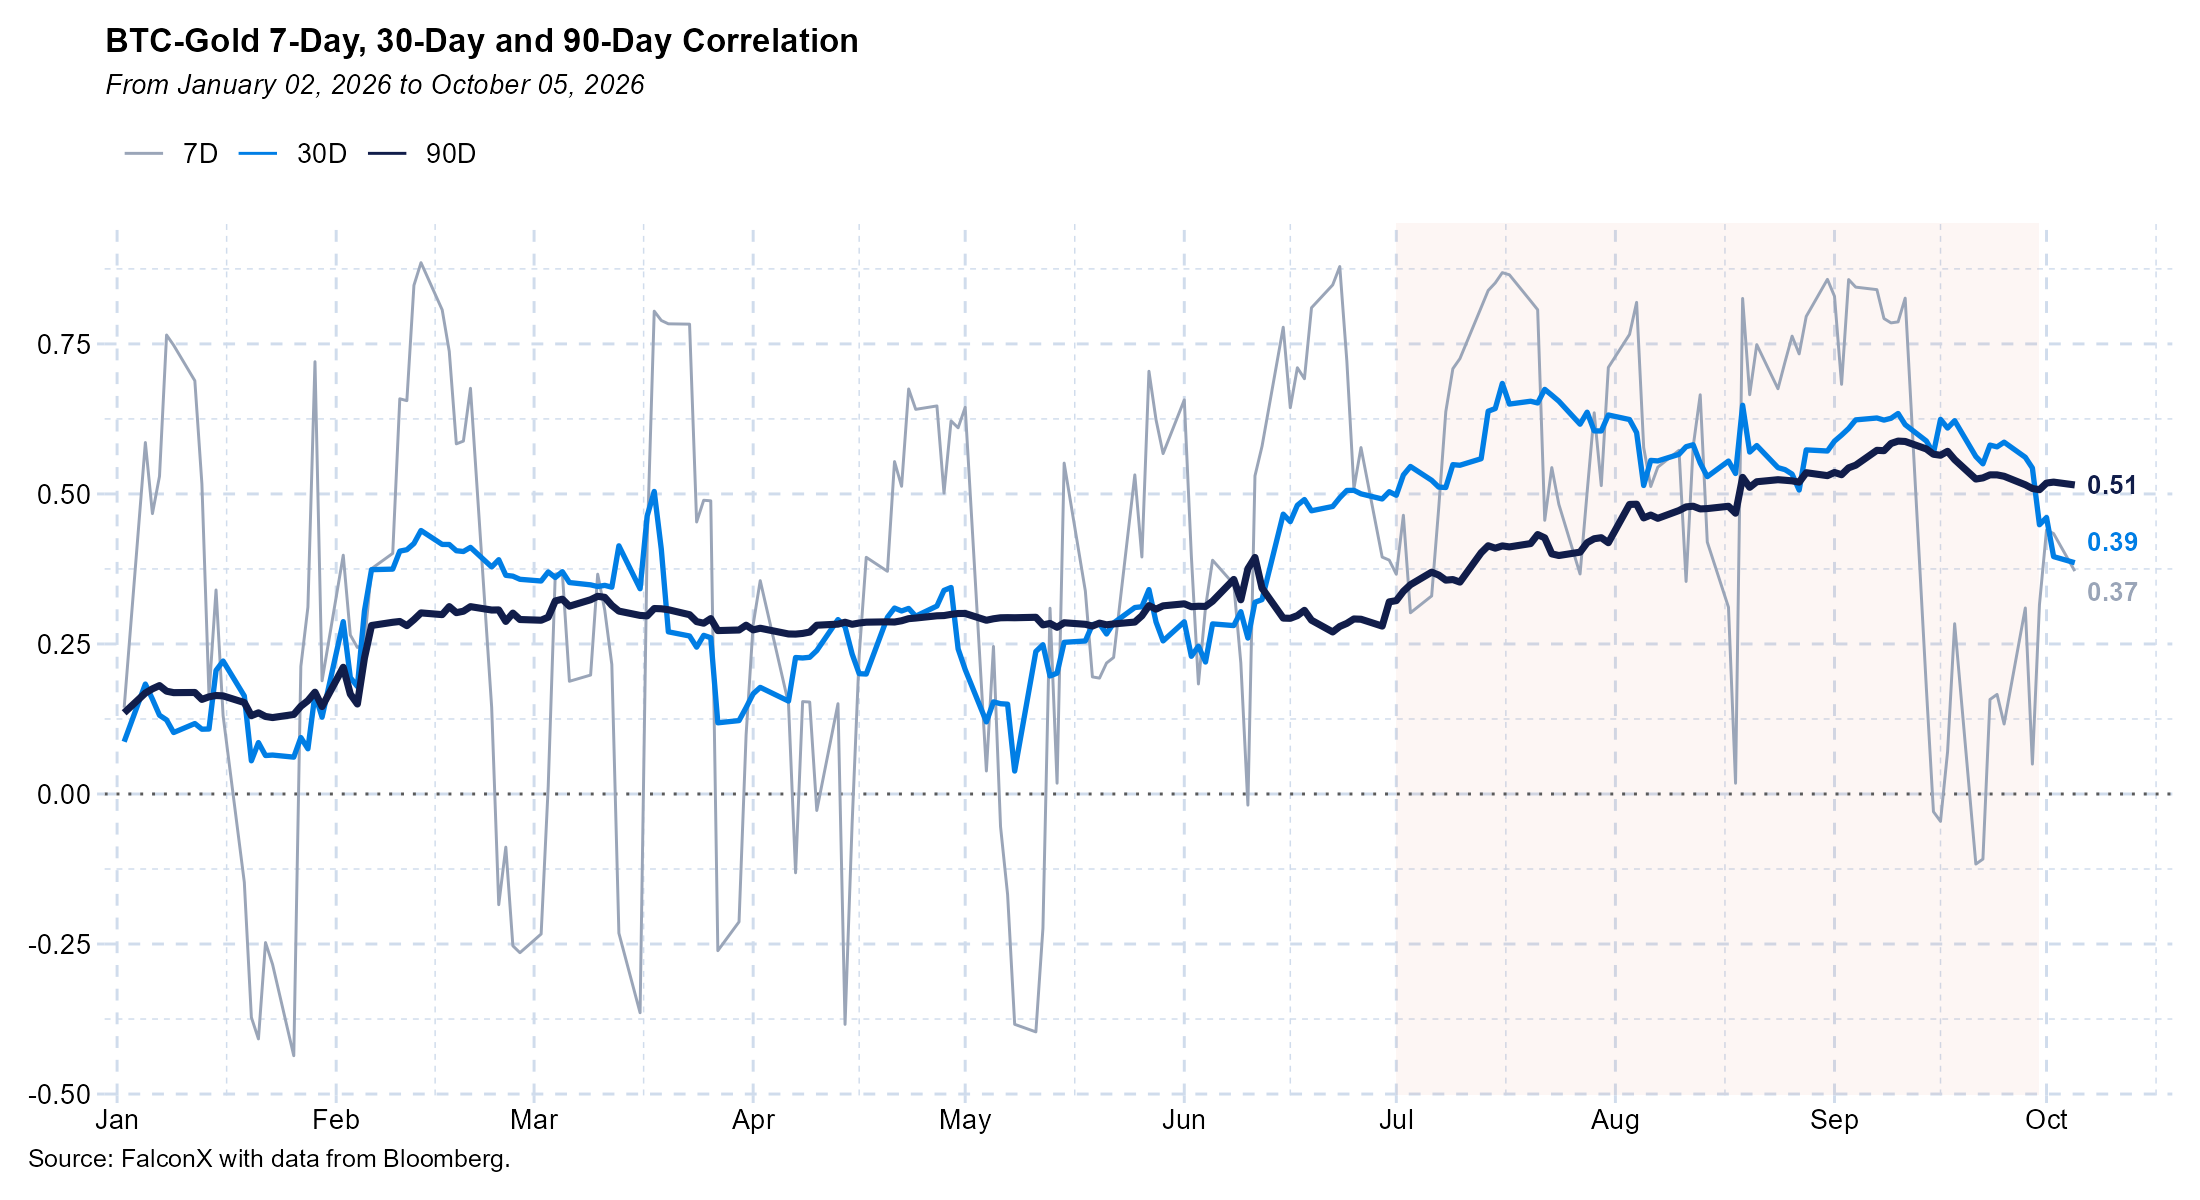
Shorter windows suggest the relationship is now weakening. BTC's 30-day correlation with gold has since fallen to 0.39 as of October 5, beginning to break down around the Fed rate hike in mid-September, while its correlation with equities picked back up. The hike may have weakened the debasement trade narrative and left BTC trading more like a risk asset.
HYPE and ZEC Developments
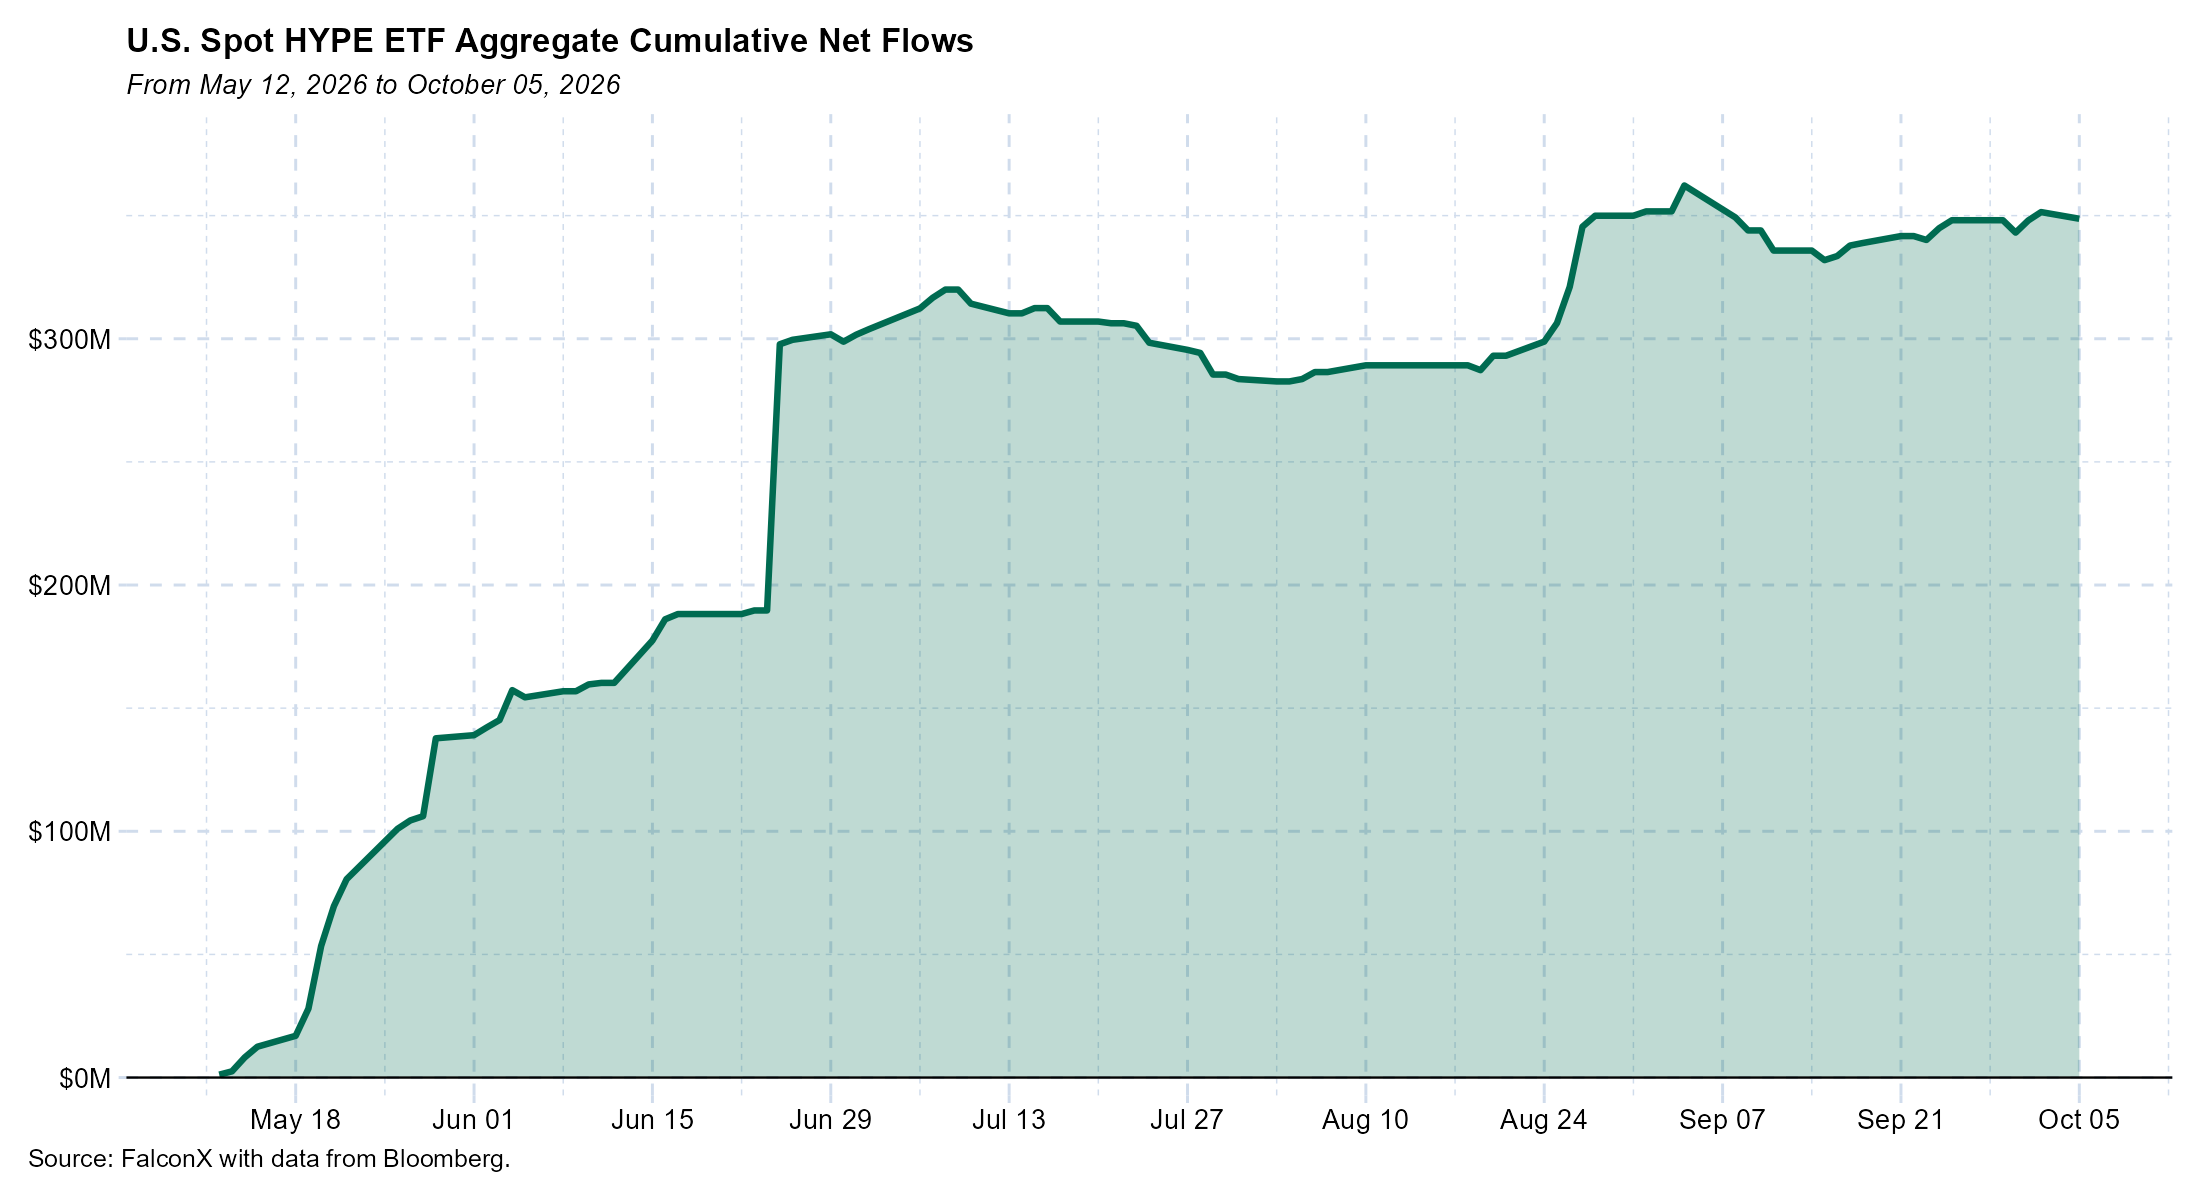
HYPE ETF inflows slowed after their 2Q26 debut: the funds took in $44M in 3Q26 versus $299M from launch through June, bringing cumulative net flows to $343M as of September 30. HYPE rose 40% over the quarter, underperforming major cryptocurrencies including BTC.
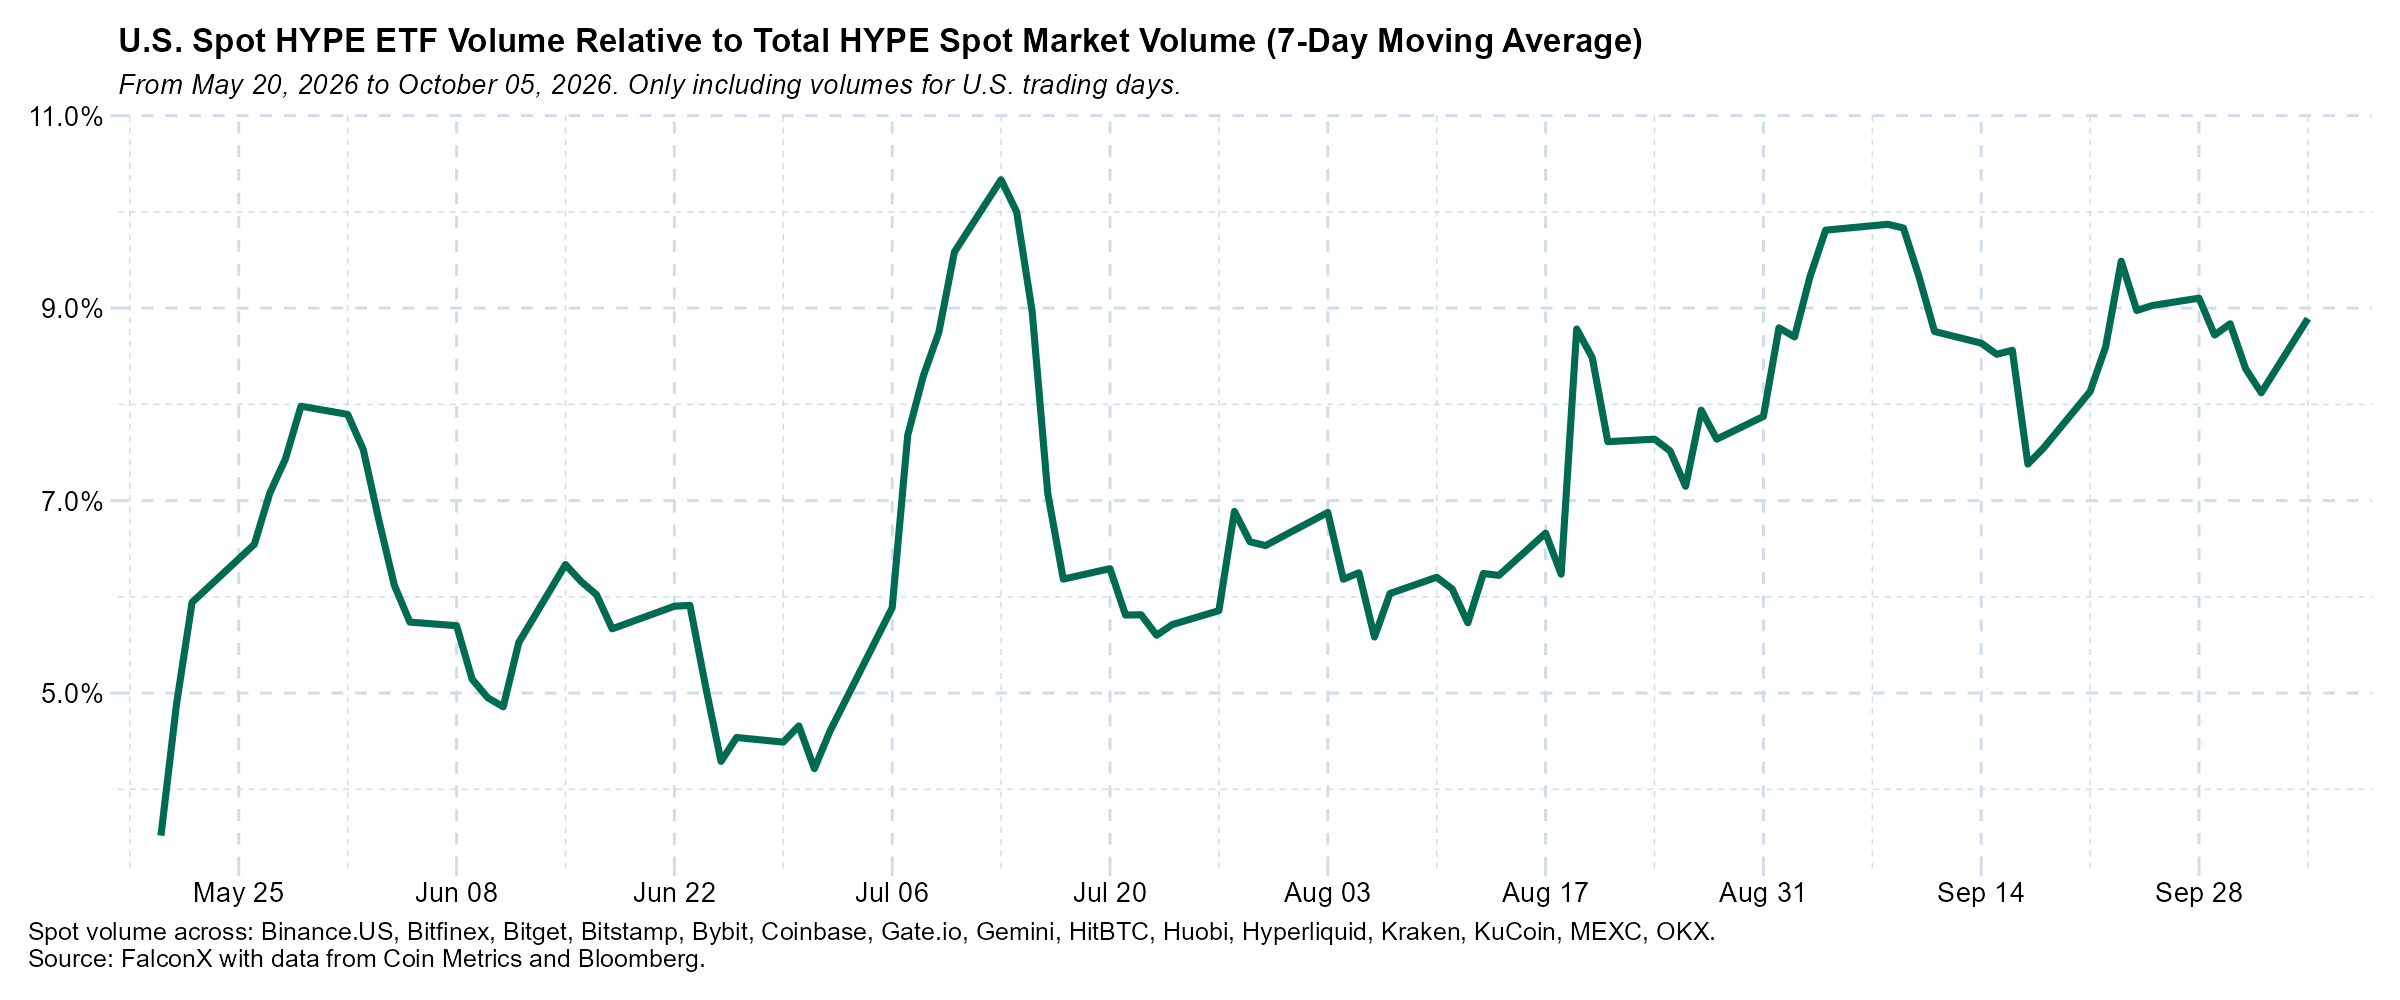
Even as flows slowed, trading in the HYPE ETFs grew relative to the underlying market. ETF volume averaged 7.6% of HYPE spot volume in the quarter (7-day average), peaking at 10.3% on July 13 and ending September at 8.8%, up from 4.7% at the end of June. That remains well below BTC, where ETF volumes rival 30-50% of spot volumes, meaning crypto-native venues continue to dominate HYPE price discovery.
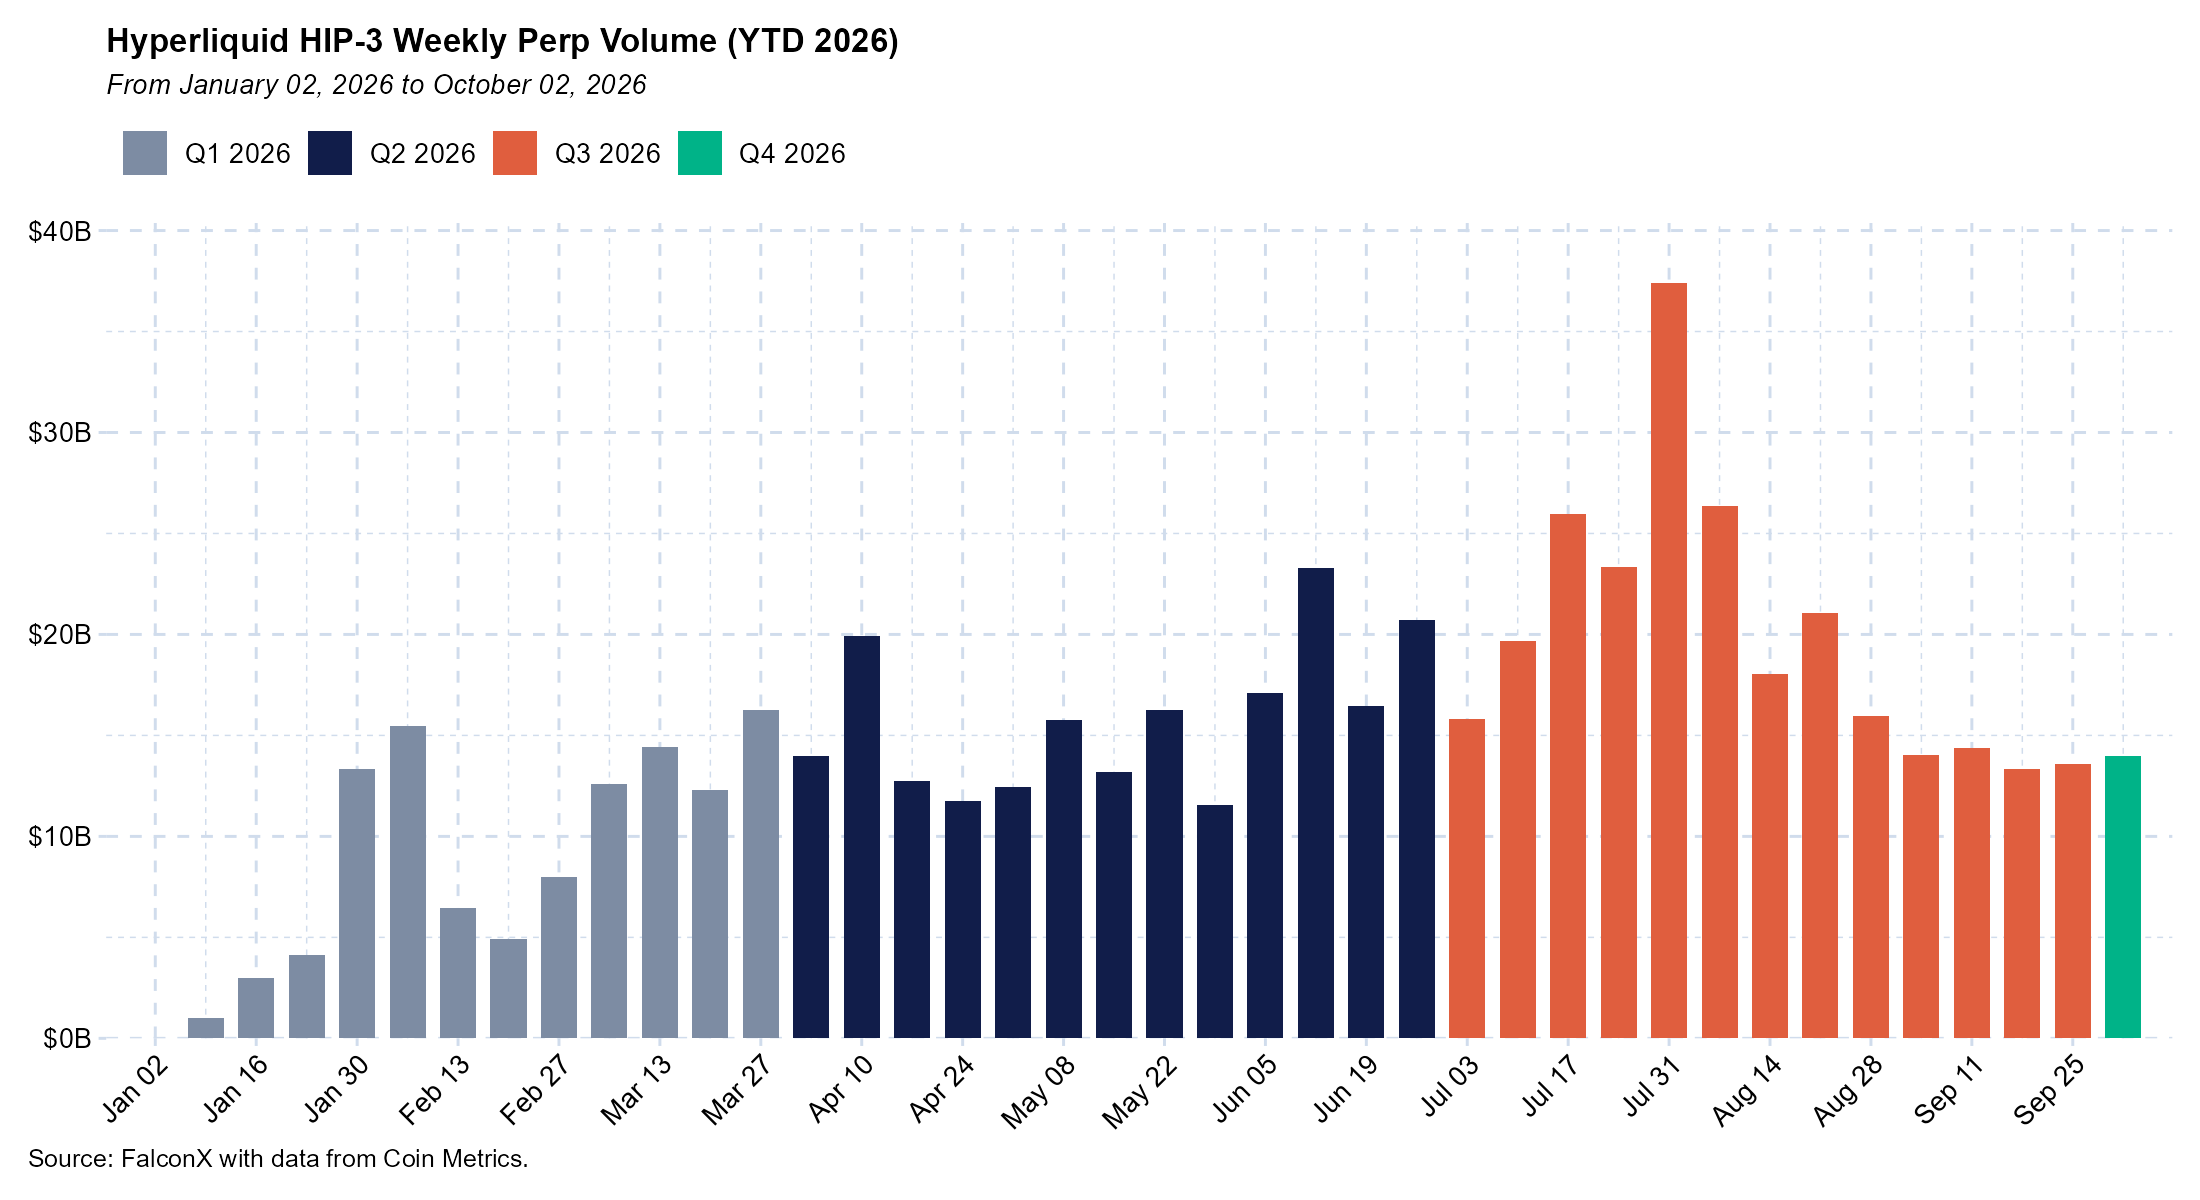
Hyperliquid's HIP-3 markets set new highs, although HIP-3 perpetual volume declined towards the end of the quarter as crypto trading took share from RWA-related instruments. HIP-3 perp volume totaled $261B in 3Q26, +27% QoQ, per data from Coin Metrics, including a record $37.4B in the week ending July 31, driven by trading in AI-related perpetuals. HIP-3 accounted for 37% of Hyperliquid perp volume in the quarter, up from 32% in 2Q26.
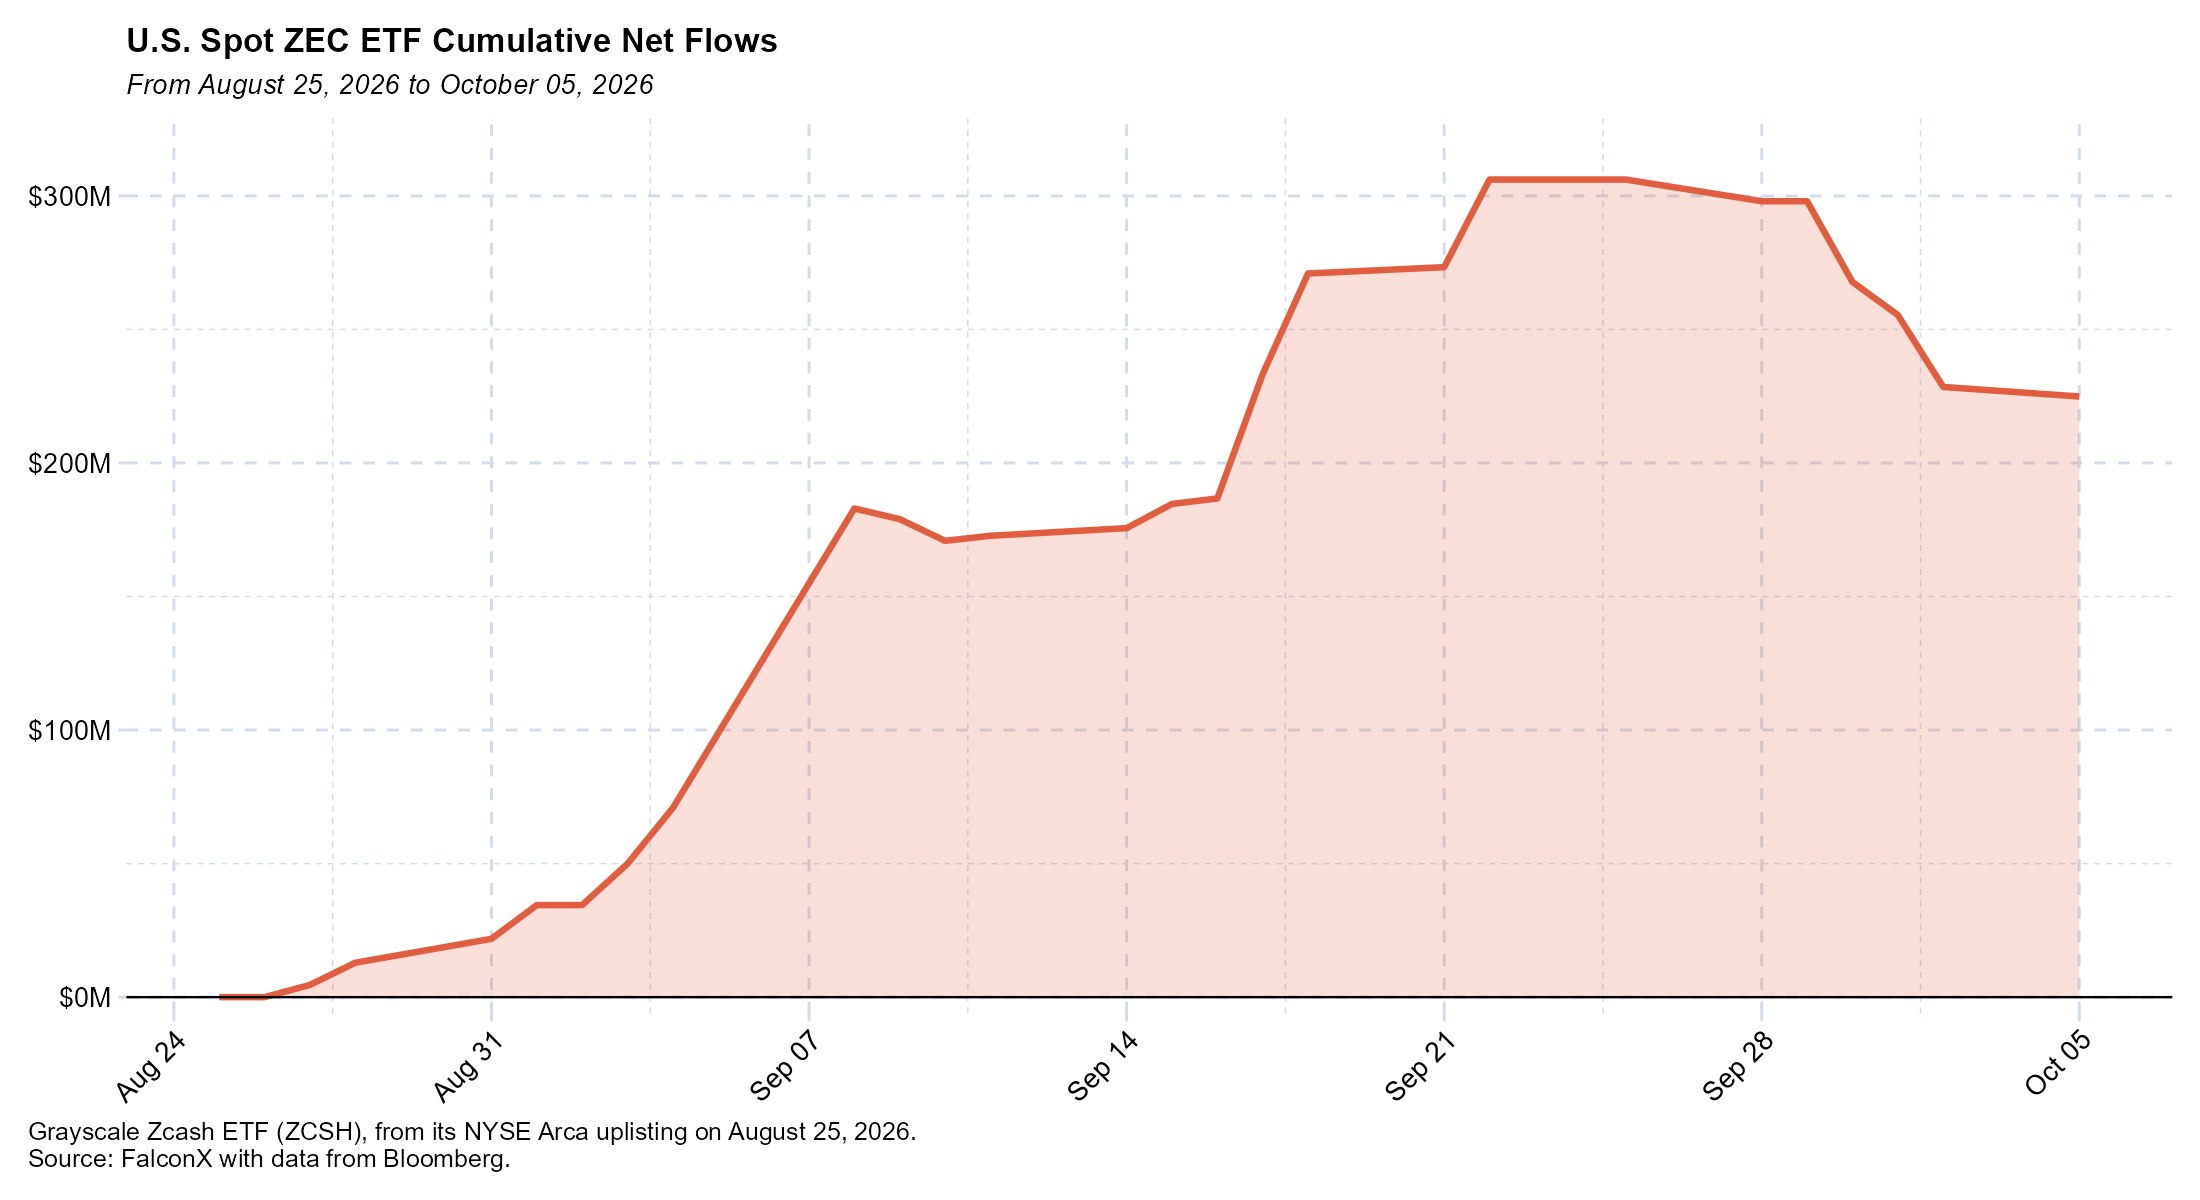
Grayscale's Zcash ETF (ZCSH), which previously traded OTC as the Grayscale Zcash Trust, began trading on NYSE Arca on August 25, delivering the first US ETF offering spot exposure to ZEC. The fund took in $268M of net inflows from its uplisting through September 30, helping lift its assets from $305M to $876M alongside ZEC's price gains, before $43M of outflows in early October.
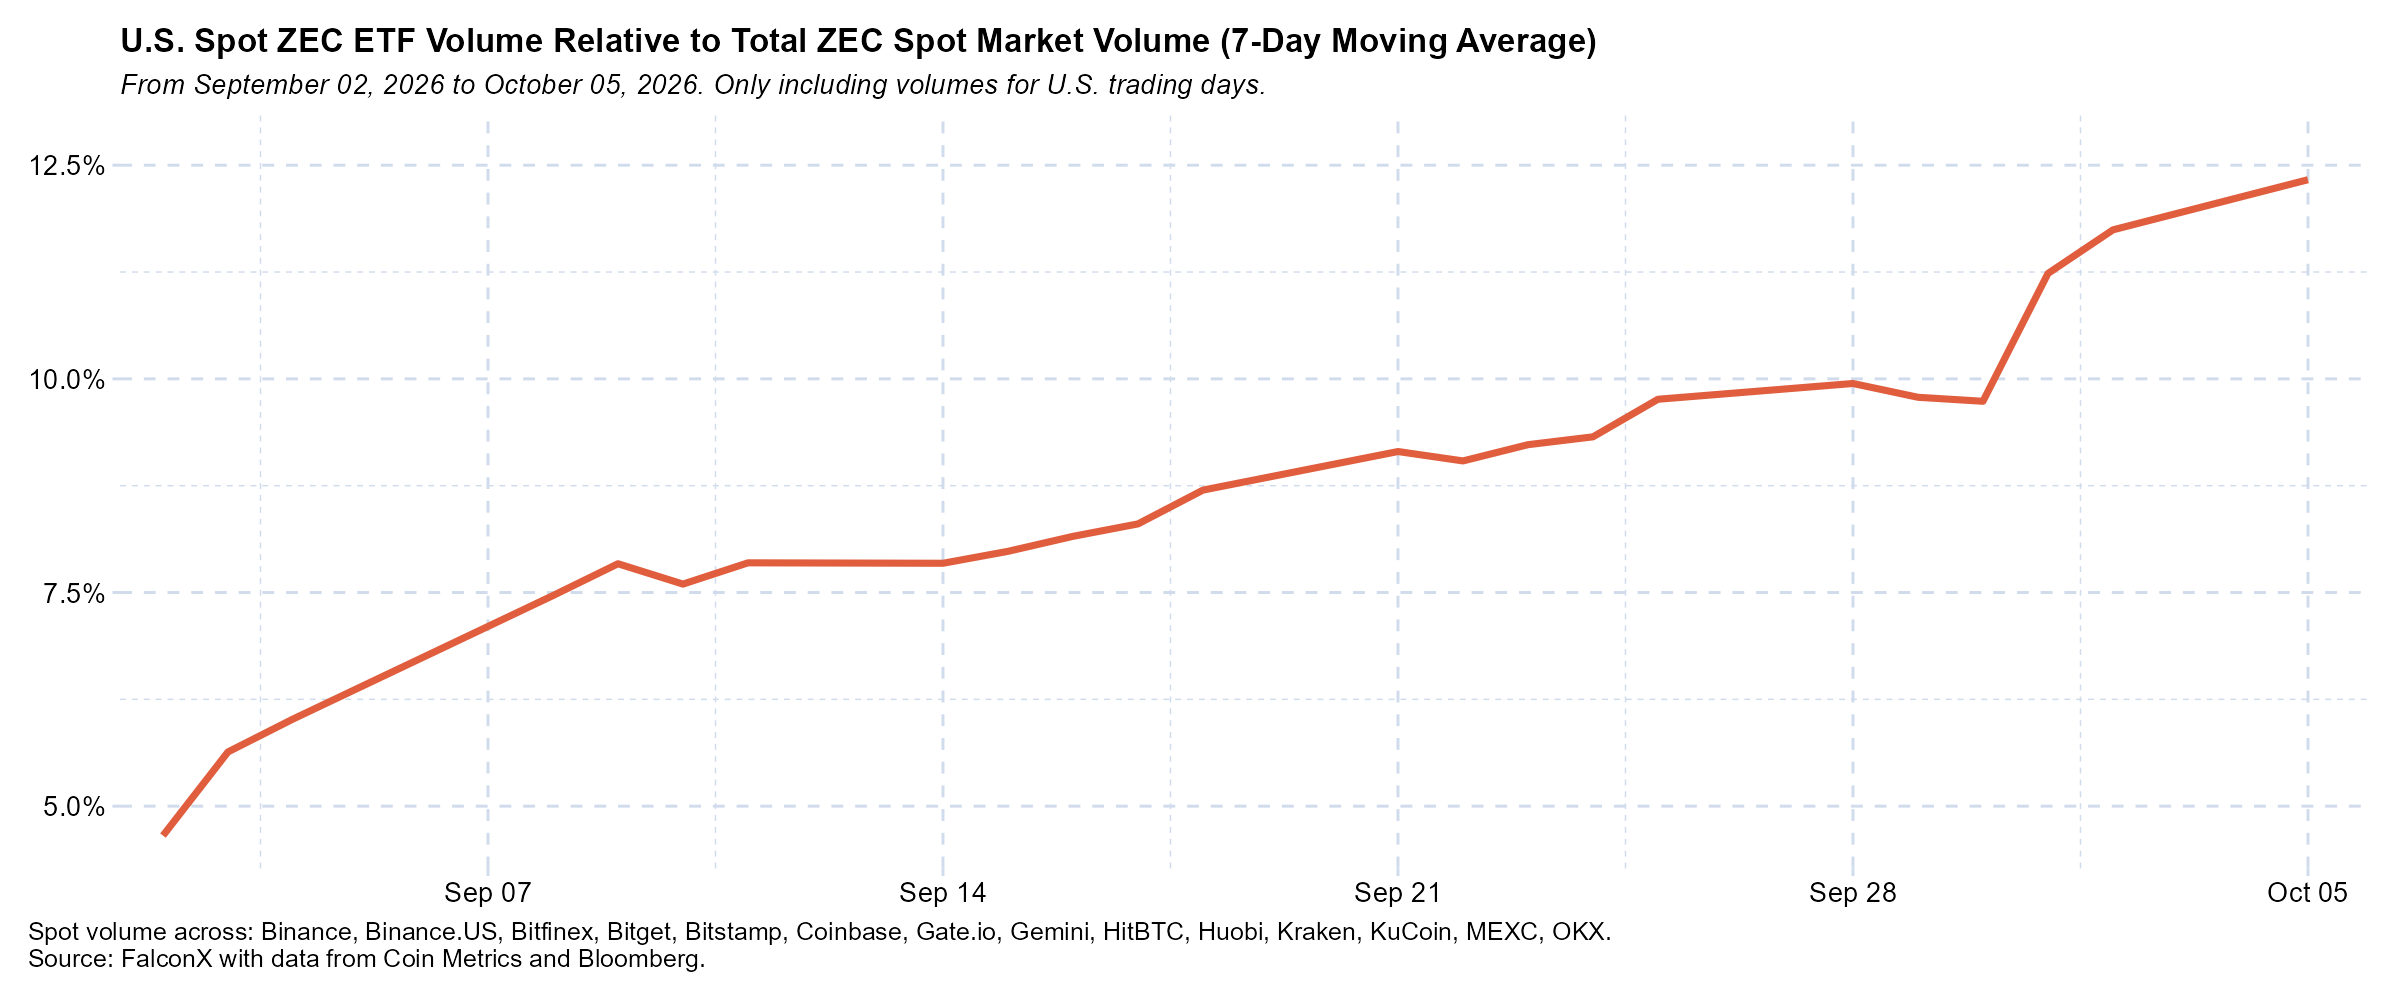
ZCSH trading has also grown steadily relative to the underlying ZEC market. ETF volume averaged 8.2% of ZEC spot volume in September (7-day average) and rose to 12.3% by October 5, already above the HYPE ETFs' 7.6% average for the quarter.
Stablecoin Supply Stabilizes
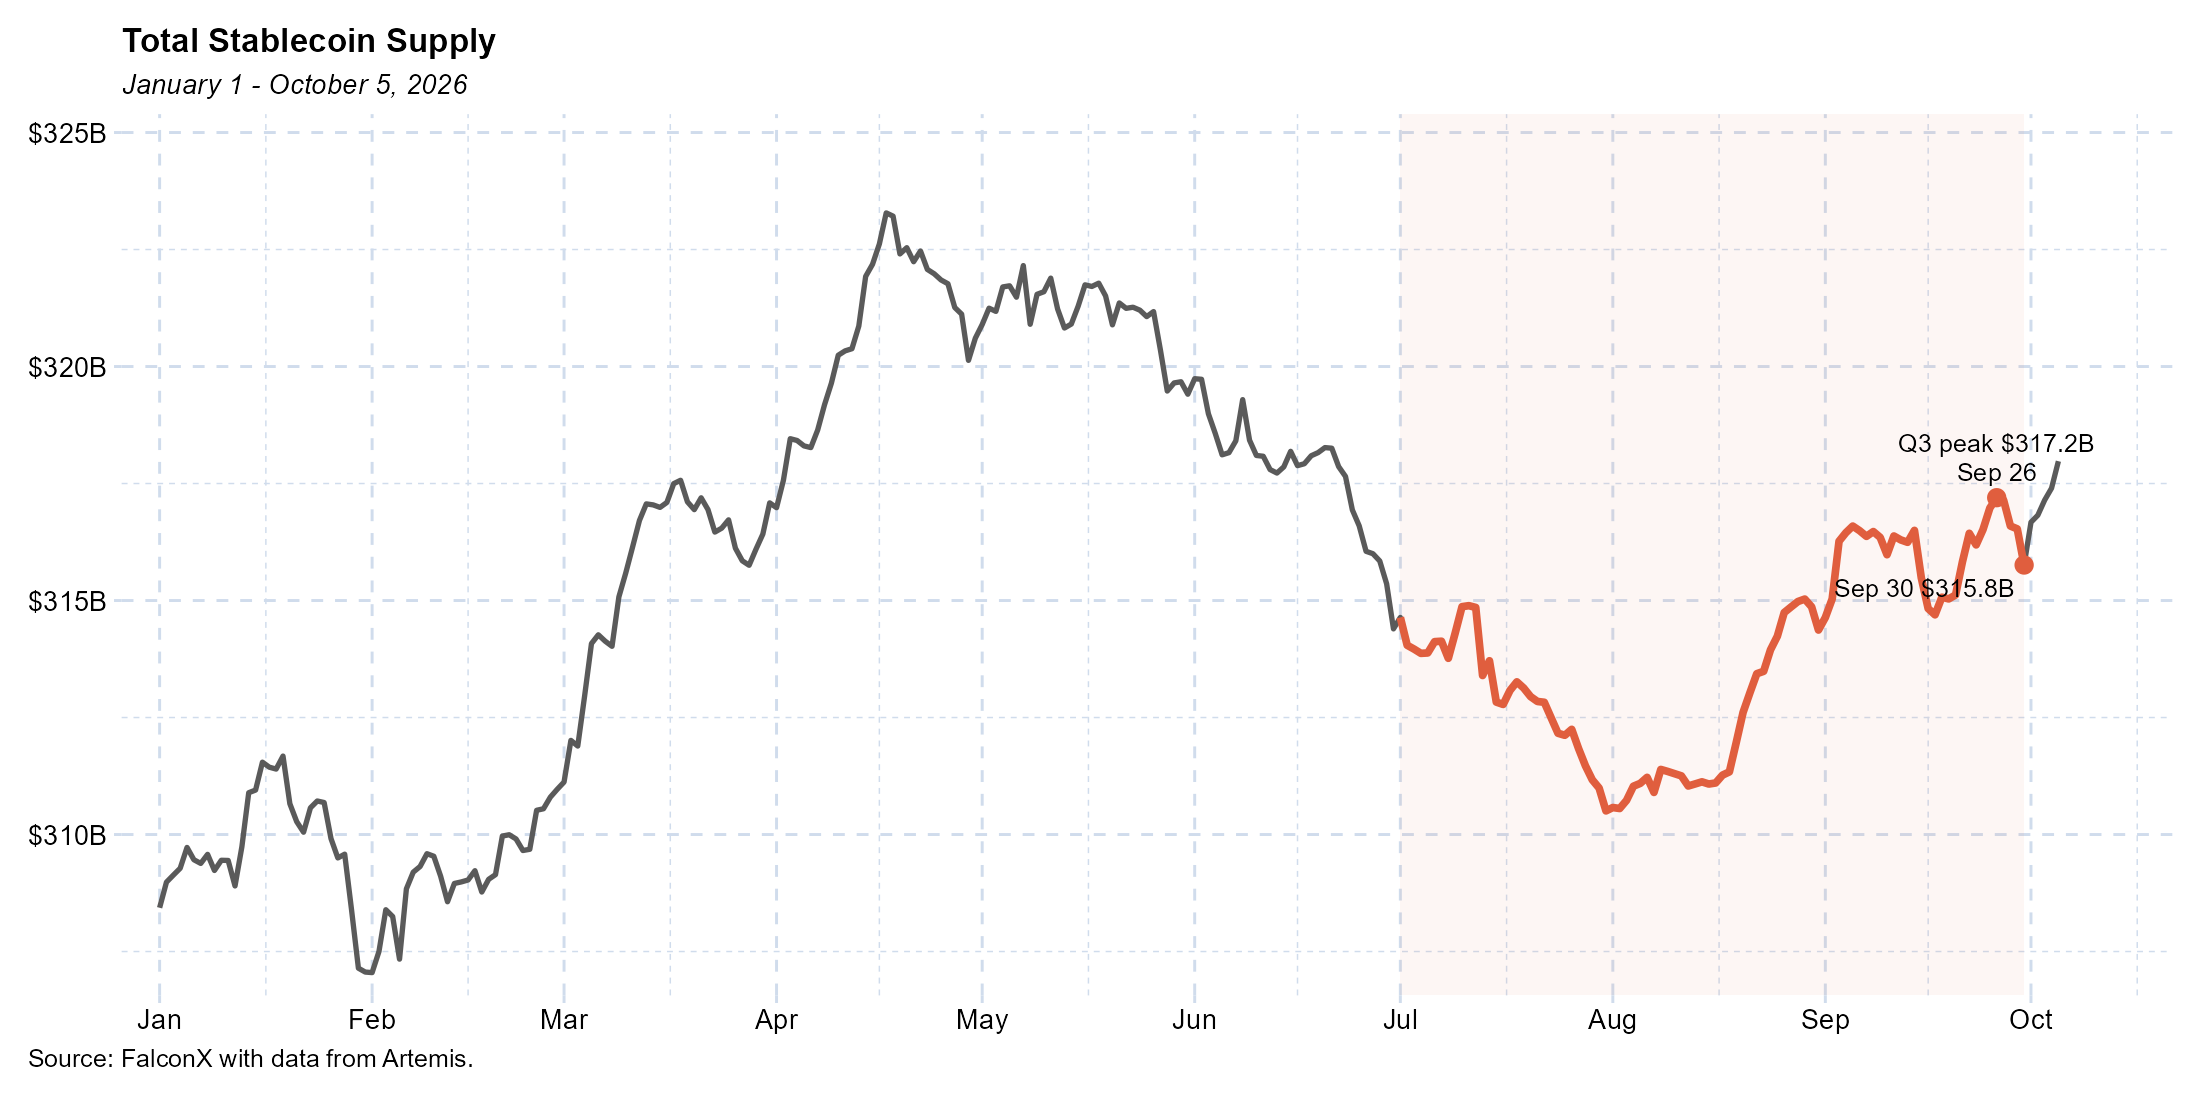
Total stablecoin supply was roughly flat in 3Q26, according to data from Artemis, rising from $314.4B on June 30 to $315.8B on September 30 (+$1.4B, +0.4%).5 Stablecoin supply extended its 2Q26 decline into a low of $310.5B on July 31 before recovering to a quarterly high of $317.2B on September 26. Supply growth continued into October, reaching $318.0B as of October 5.
By stablecoin, RLUSD (+$0.9B), USDe (+$0.7B), Tether Gold (+$0.5B), USDC (+$0.3B) grew, while USDS (−$1.1B), USYC (−$0.7B), USDT (−$0.5B), USD1 (−$0.2B) declined.
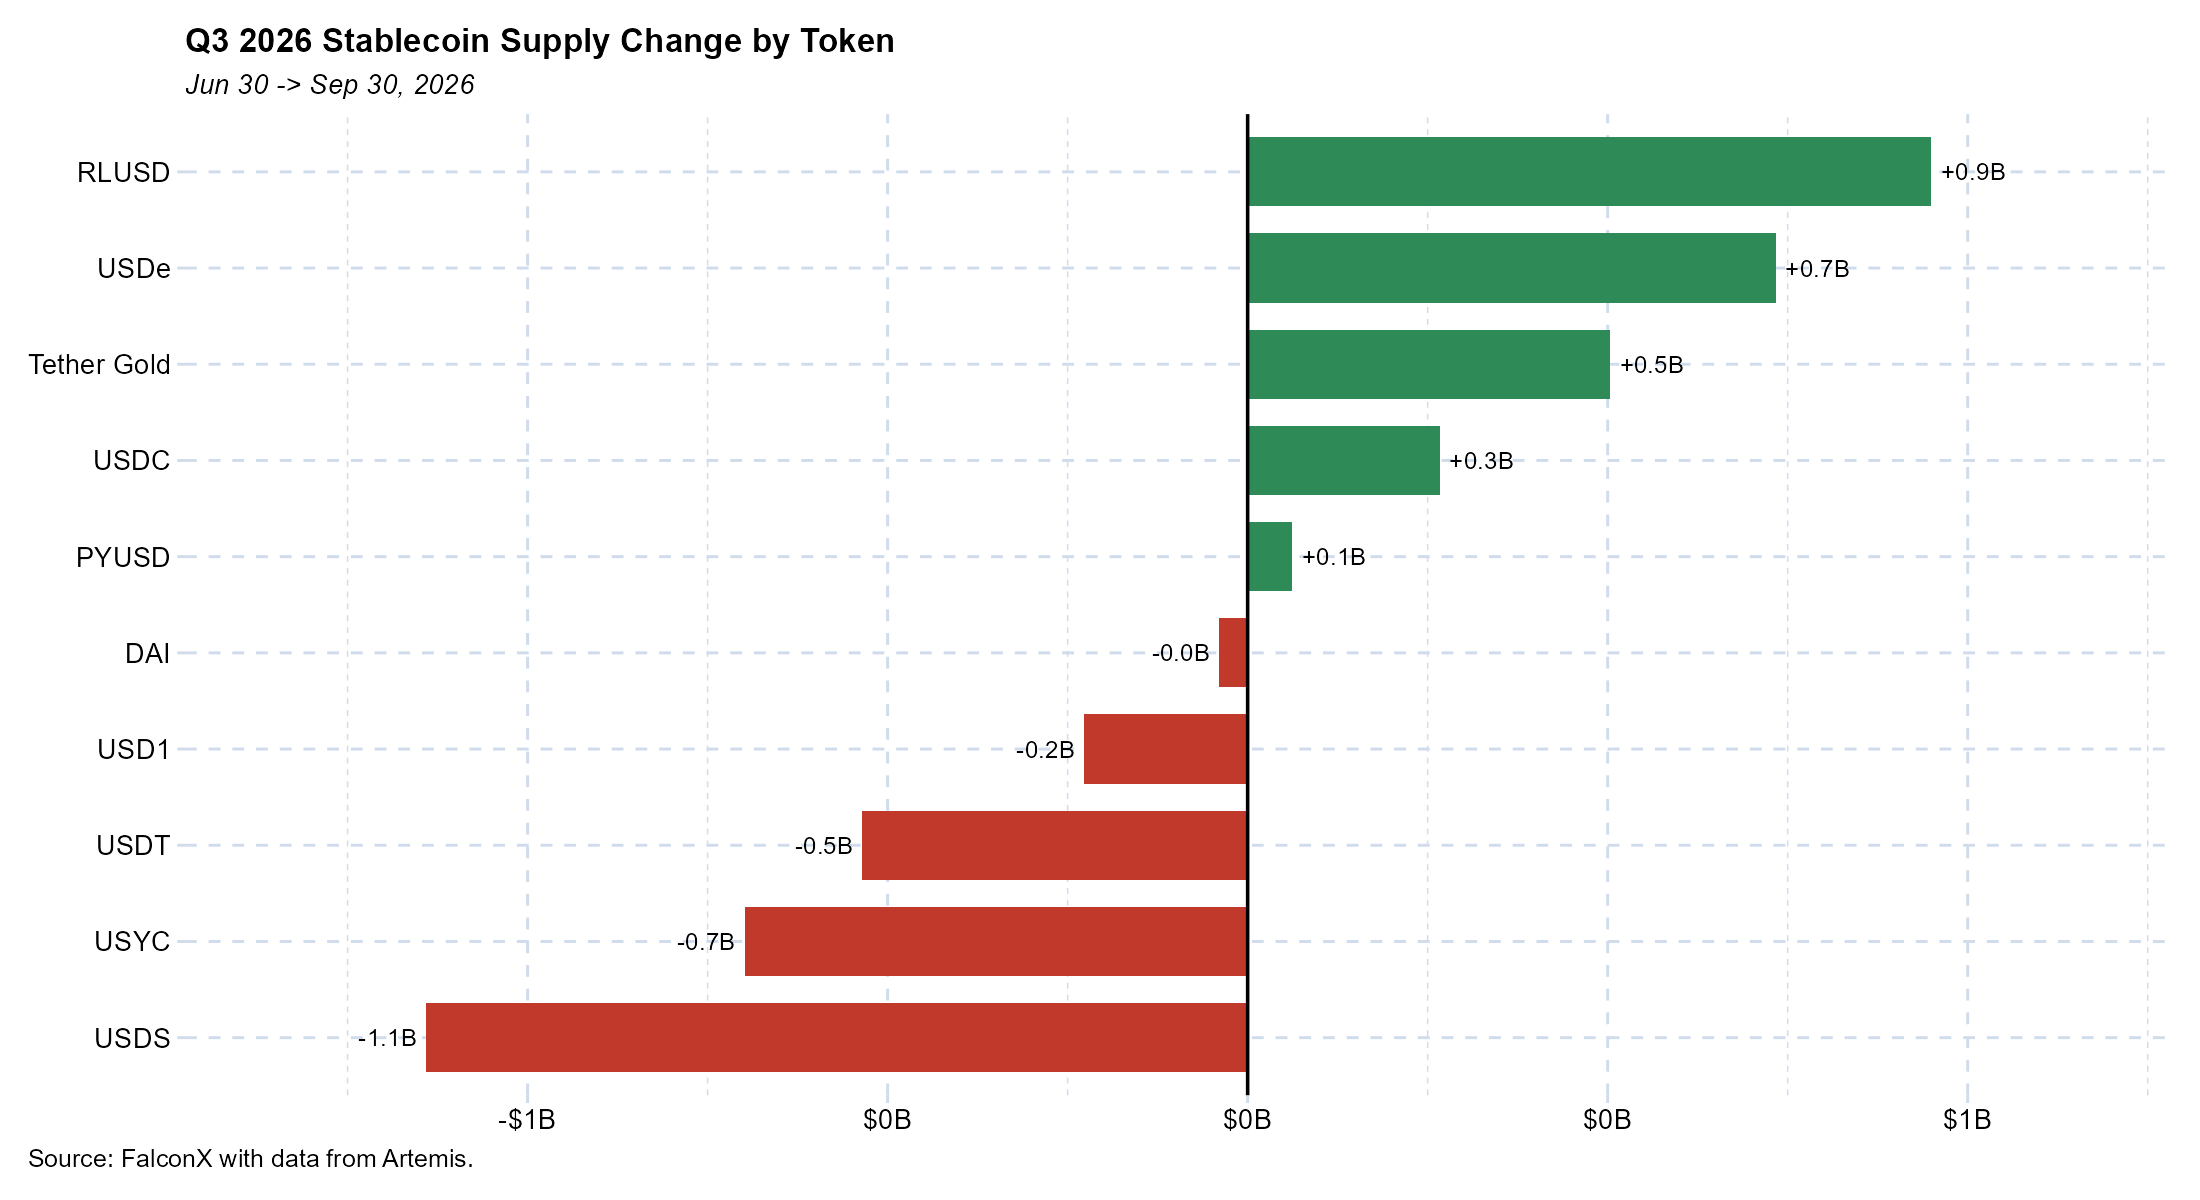
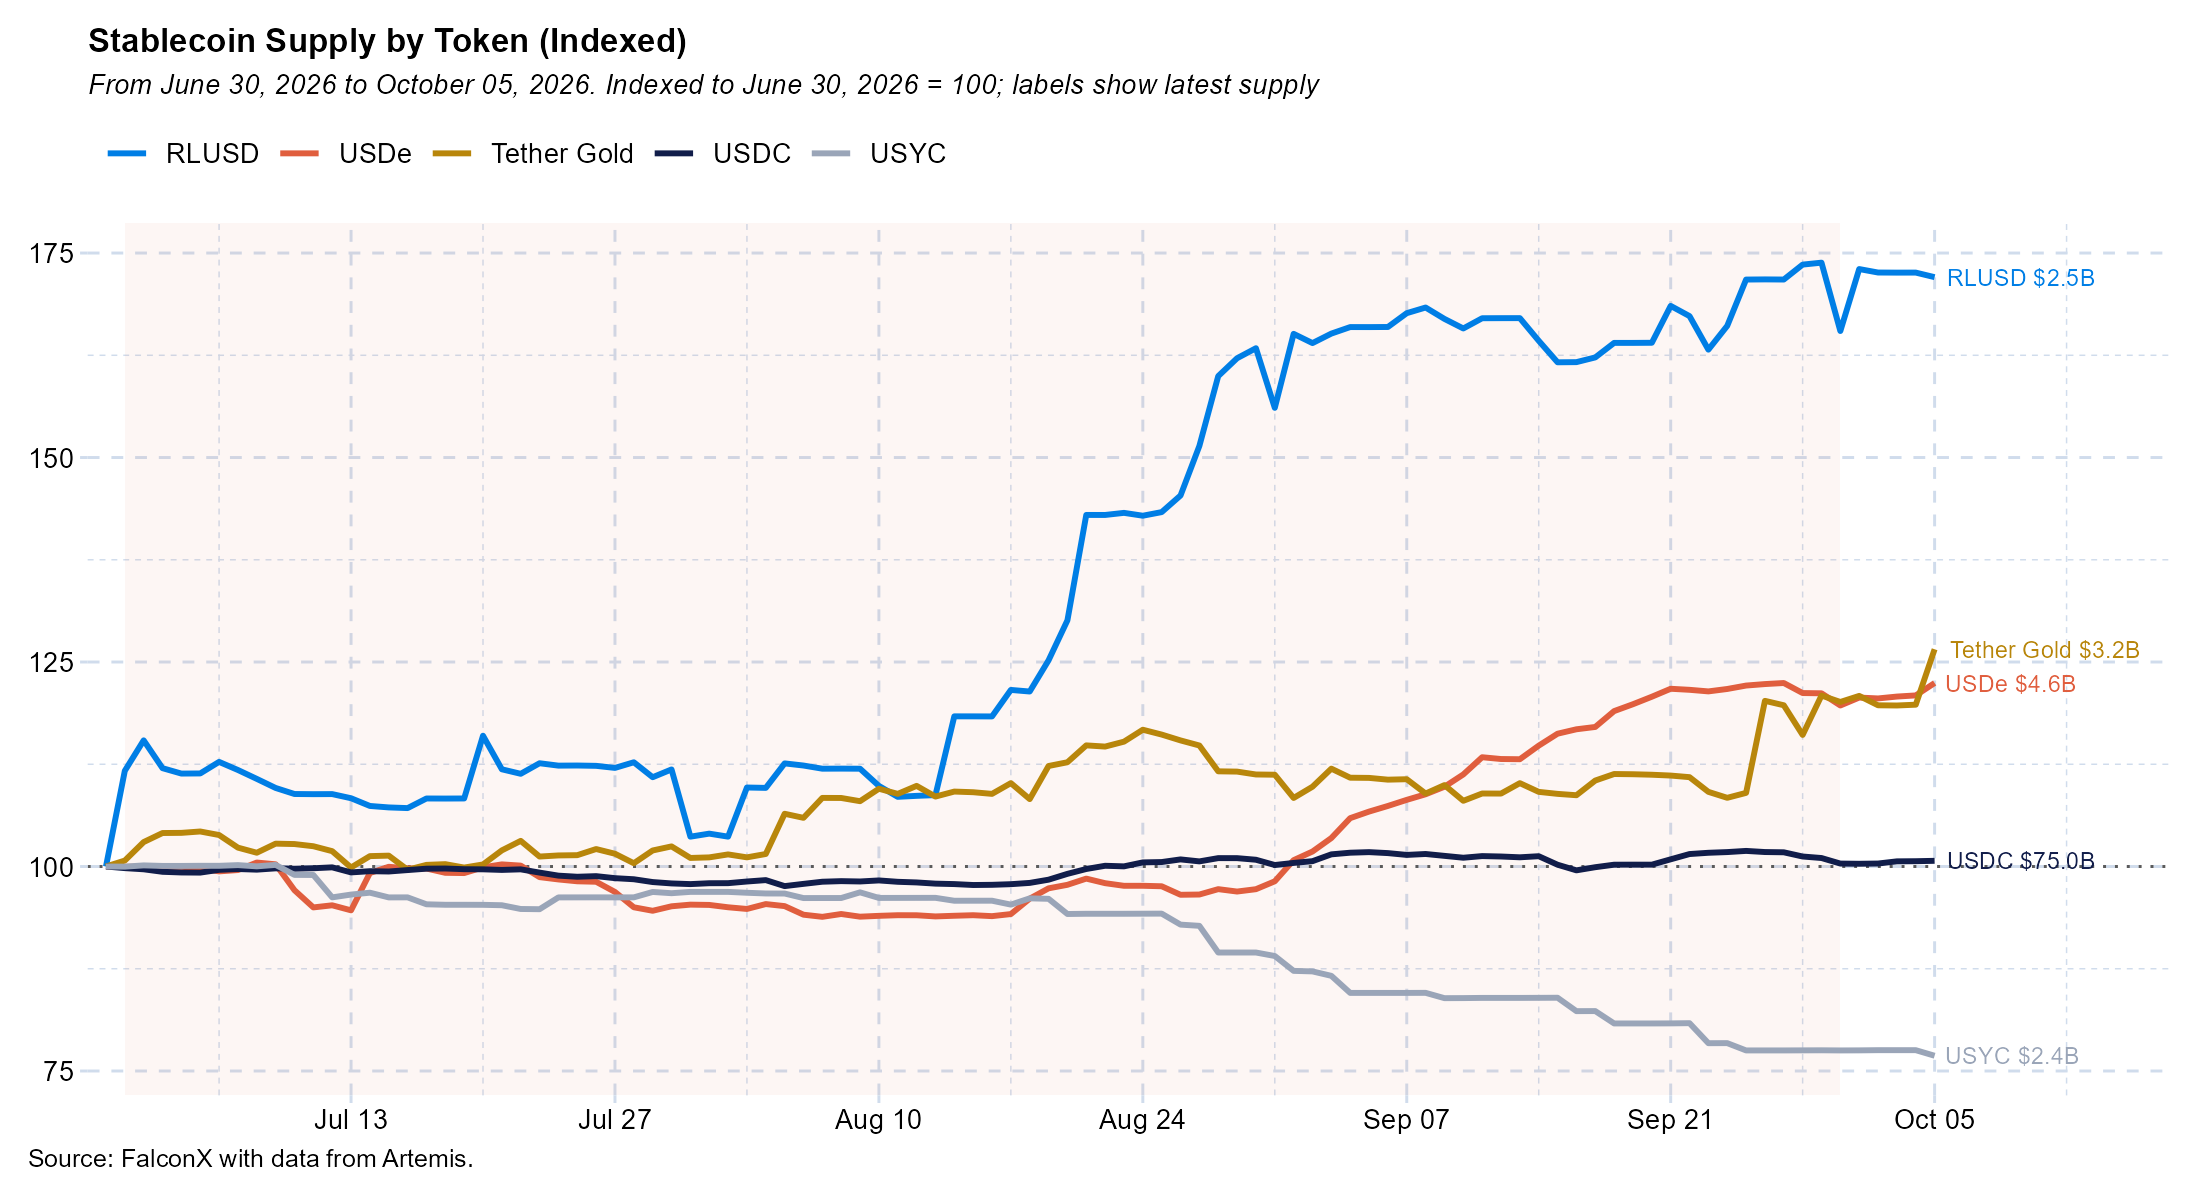
The quarter's net change masks notable moves within it. Supply fell $3.9B through July, led by USDC (-$1.6B), USDS (-$1.6B) and USD1 (-$0.6B), before recovering $5.3B from August. USDe stood out late in the quarter, rising 30% from its Q3 low of $3.5B on August 7 to $4.6B on September 27, with $0.7B of that added in September alone, though it remains below its January peak of $6.3B. RLUSD grew 66% (+$0.9B), almost entirely in August, while Tether Gold supply rose 20% and USYC supply declined 23%.
NEAR, ZEC and UNI Lead Altcoin Gains
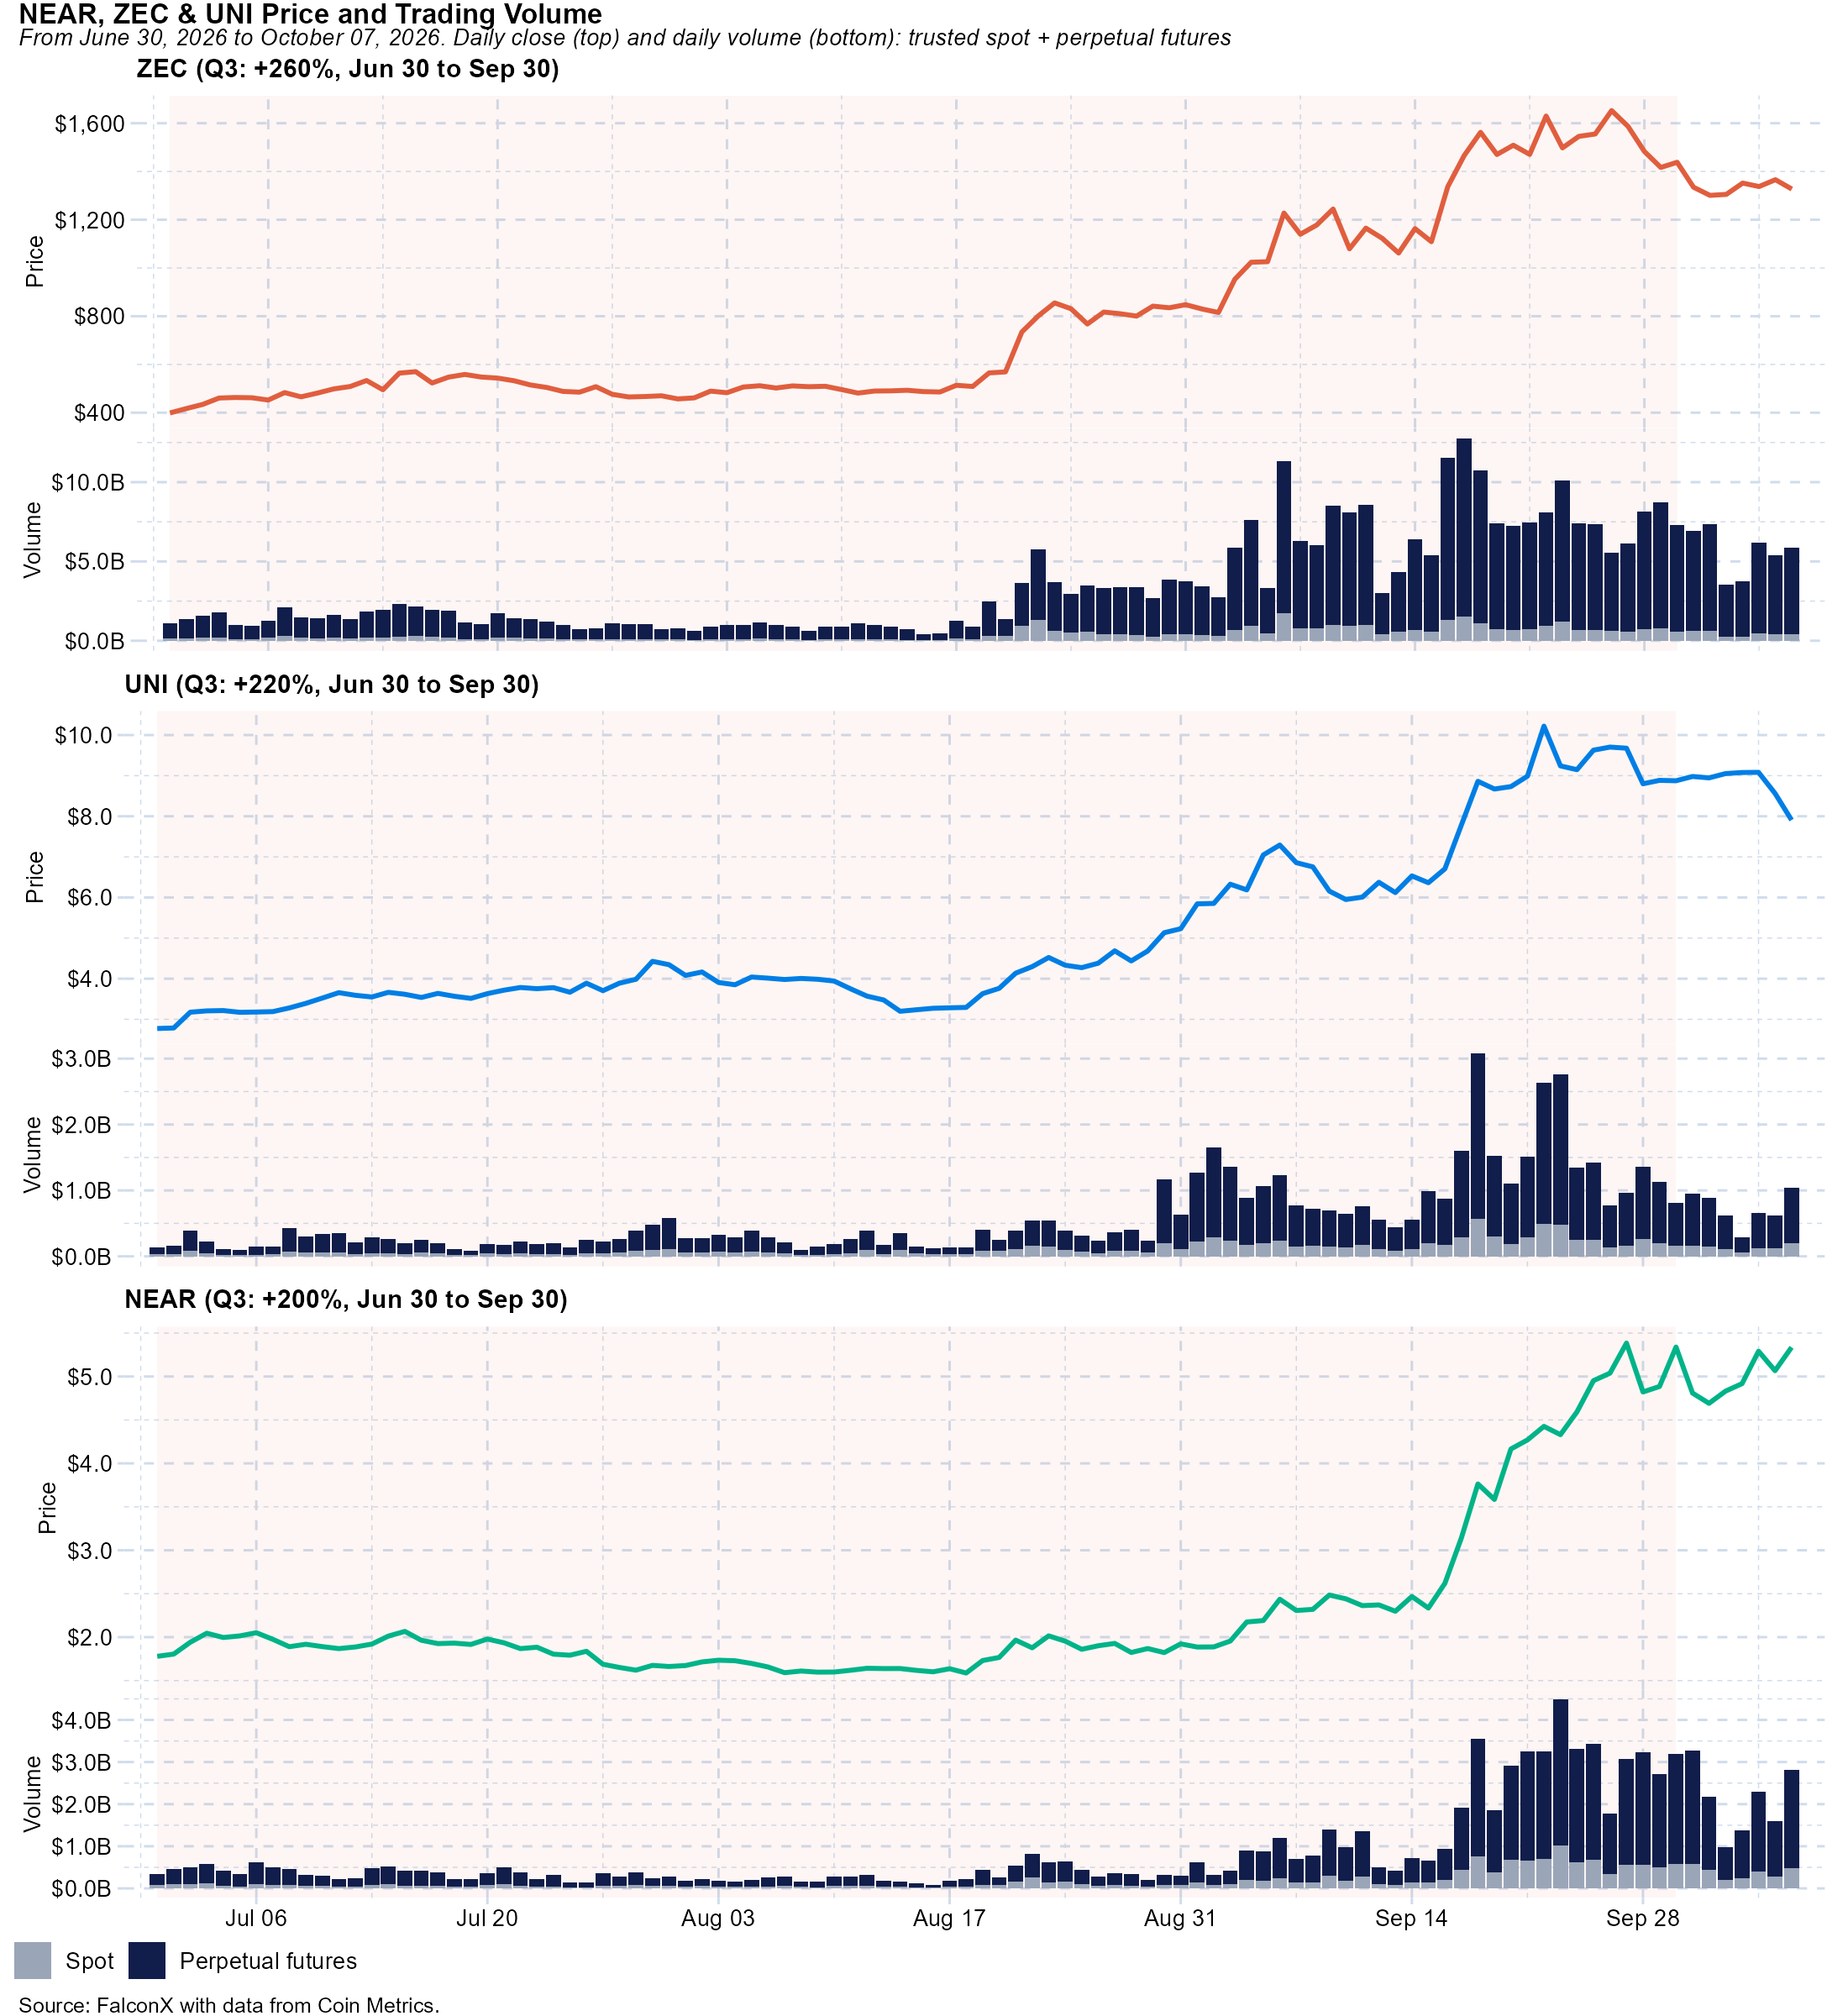
Several large-cap altcoins outperformed BTC significantly in the quarter. ZEC rose 260%, UNI climbed 220% and NEAR gained 200%, versus BTC's 43%, with most of the move coming from late August onward. ZEC was supported by its successful implementation of its Ironwood Upgrade, helping quell earlier concerns of a potential exploit, while NEAR was lifted in part by increased activity on its intents offering. UNI appeared to have benefited from record revenue generation, driven by its role as the leading DEX on Robinhood Chain.
The Q4 Setup
The quarter's data suggests a market that has moved from deleveraging to re-risking as open interest across futures and options increased and BTC ETF flows turned positive. Volumes have yet to firmly follow, and early-October activity has eased from September's pace.
While Q4 tends to have positive seasonality for BTC, especially in October (+15% median, per data from Coinglass), there may be fewer tangible catalysts to add further legs to the rally in the near term, with some of the CFTC and SEC regulatory announcements after the failed CLARITY Act vote now behind us and rising rates driving growth concerns. BTC has now traded in a 2+ week range of $83K to $87K; a breakout may set the tone for the quarter.
Endnotes
¹ Spot exchange set: Binance, Bitfinex, Bitstamp, Bullish, Bybit, Coinbase, Crypto.com, Deribit, Gemini, itBit, Kraken, OKX
² Futures set: Binance, Bitfinex, Bullish, Bybit, CME, Coinbase Derivatives, Coinbase International, Crypto.com, Deribit, dYdX, Hyperliquid, Kraken, OKX.
³ Futures data exclude BitMEX, which wound down in 3Q26, from all periods, and prior quarters are restated for Coin Metrics revisions (2Q26 futures volume: $9.6T vs. $9.0T previously reported).
⁴ Gold ETF set: GLD, IAU, GLDM, IAUM, SGOL, OUNZ, AAAU
5 Stablecoin data reflect Artemis revisions.
This material is for informational purposes only and is only intended for sophisticated or institutional investors. Neither FalconX Limited, FalconX Bravo, Inc., FalconX Delta, Inc., FalconX Golf Pte Ltd., Solios, Inc., Falcon Labs S. DE. R. L., KestrelX, Ltd., KingfisherX Limited, nor Banzai Pipeline Limited service retail counterparties, and the information in this material is NOT intended for retail investors. This material is not (i) an offer, or solicitation of an offer, to invest in, or to buy or sell, any interests or shares, or to participate in any investment or trading strategy, (ii) intended to provide accounting, legal, or tax advice, or investment recommendations, or (iii) an official statement of FalconX or any of its affiliates. Any information contained in this material is not and should not be regarded as investment advice, investment research, debt research, or derivatives research for the purposes of the rules of the CFTC, the Securities and Exchange Commission, or any other relevant regulatory body.
No discussion of a particular company or product shall be considered an endorsement of such company or product. Past performance is not indicative of future results. FalconX, and its affiliated parties, including 21shares, may hold positions in, act as a market maker for, or otherwise have a financial interest in, assets discussed herein, and may benefit from any price movements or transactions involving the subject company. This may change without notice.
Prior to entering into any proposed transaction, recipients should determine, in consultation with their own investment, legal, tax, regulatory and accounting advisors, the economic risks and merits, as well as the legal, tax, regulatory and accounting characteristics and consequences of the transaction. Pursuant to the Dodd-Frank Act, over the counter derivatives are only permitted to be traded by "eligible contract participants" (“ECP”s) as defined under Section 1a(18) of the CEA (7 U.S.C. § 1a(18)). Do not consider derivatives or structured products unless you are an ECP and fully understand and are willing to assume the risks.
Solios, Inc. and FalconX Delta, Inc. are registered as federal money services businesses with FinCEN. FalconX Bravo, Inc. is registered as a Swap Dealer with the U.S. Commodity Futures Trading Commission and is a member of the National Futures Association. FalconX Limited, FalconX Bravo, Inc., FalconX Delta, Inc., Falcon Labs S. DE. R. L., and Solios, Inc. are not registered with the Securities & Exchange Commission or the Financial Industry Regulatory Authority. FalconX Golf Pte. Ltd. is not registered or licensed by the Monetary Authority of Singapore (MAS). FalconX Limited is licensed by the MFSA as a Class 2 Crypto-Asset Service Provider (Regulation (EU) 2023/1114). It is also licensed as a Financial Institution (Cap. 376) exclusively for EMT payment services. FalconX is not a registered broker-dealer with the U.S. SEC or a member of the Financial Industry Regulatory Authority (FINRA). FalconX’s ability to offer trading in tokenized stocks and other products mentioned herein may be restricted in certain jurisdictions.
"FalconX" is a marketing name for the FalconX Group and its affiliates. Availability of products and services is subject to jurisdictional limitations and capabilities of each FalconX entity. For information about which legal entities offer trading products and services, or if you are considering entering into a derivatives transaction, please reach out to your Sales or Trading representative.
.jpg)