A Most Interesting Rally: A Couple of Subtle Liquidity Signals That Set This Market Regime Apart
This rally’s quiet volume, shifting time zones, and surging ETF flows suggest a very different market structure.


The crypto market’s rebound since mid-April has been nothing short of breathtaking.
Correlations with risk assets remain choppy as market drivers whiplash between macro and industry factors. This week alone: a packed earnings season for equities, continued back-and-forth on trade and fiscal policy and still reminding investors that the macro outlook remains uncertain, more reasonable rules opening the 401(k) doors to crypto, a pro-industry message from VP JD Vance in Bitcoin Vegas, and yet another exciting round of companies raising cash to stack BTC (and now other assets) on their balance sheets.
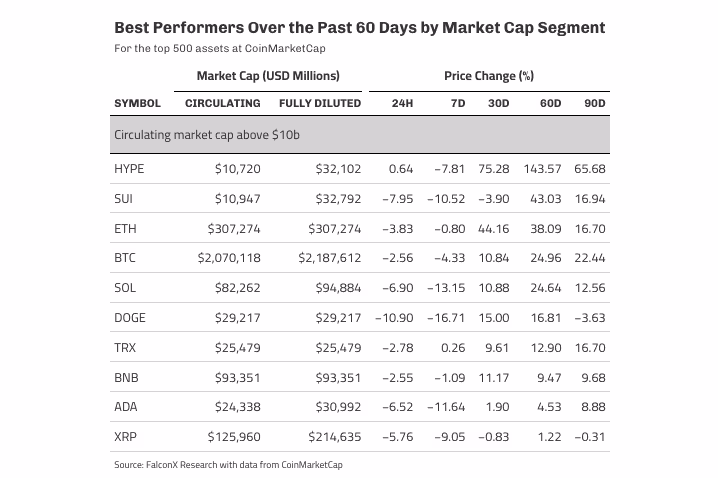
Still, despite the flattish or slightly negative price action over the past few weeks, nearly every major crypto asset (defined here as those with a circulating market cap over $10 billion) is showing double-digit gains over the past 60 days, as the table below shows. HYPE has dominated across the 30-, 60-, and 90-day windows, while the runner-up spot has rotated between ETH, SUI, and BTC.
Interestingly, the liquidity dynamics of this most recent rally have been somewhat different from the previous ones in at least two regards.
Breaking the trend of the past few years, this breakout hasn’t come with a spike in U.S. trading activity.
For a while, U.S.-centric themes such as Fed moves, election speculation, ETF launches, and regulatory shifts have dominated market narratives, driving U.S. trading hours to a growing share of global volume.
This trend flipped since in April 2025. As the chart below shows, spot trading volumes during U.S. trading hours for the majors BTC, ETH, and SOL have been climbing steadily over the past three years to hit an all-time high of over 55% at the beginning of 2025. But for the first time since the election, they’ve now dropped below the 45% mark.
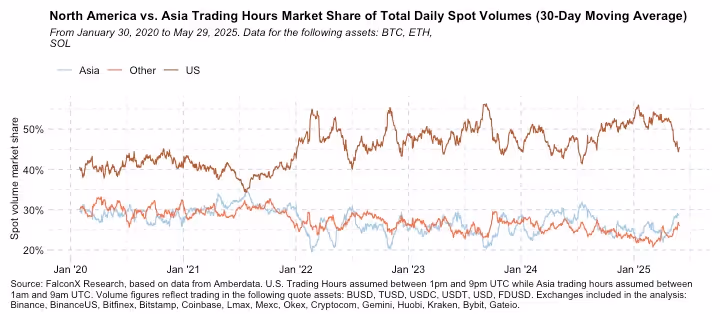
A lower share of spot trading volumes during U.S. hours can signal a shift in the types of investors driving market price action. It may point to increased influence from non-U.S. portfolio flows or suggest that U.S. investors are focusing more on markets beyond spot crypto, something we’ll provide evidence for below.
Whether this is part of a larger trend or just a temporary dip, it's a signal worth watching. It suggests this leg up may be running on slightly different fuel.
Also unlike the past few years, this rally has not come with a broad surge in spot trading volumes.
BTC average daily spot volumes, which held above $15 billion on a 30-day rolling basis since the election, dropped during the April sell-off and have yet to climb back above $10 billion. The exception is ETH, where volumes have been punching above their weight thanks to a strong 30-day price rebound but still remain well below the recent highs.

There are a few reasons why spot volumes have been slow to recover despite the sharp rally in prices.
One possibility is that institutional delta-neutral trading, a major component of crypto activity, hasn’t fully returned. For example, BTC’s CME annualized basis is only now approaching double-digit levels, and open interest remains more than 20% below its yearly high even as prices near all-time highs.
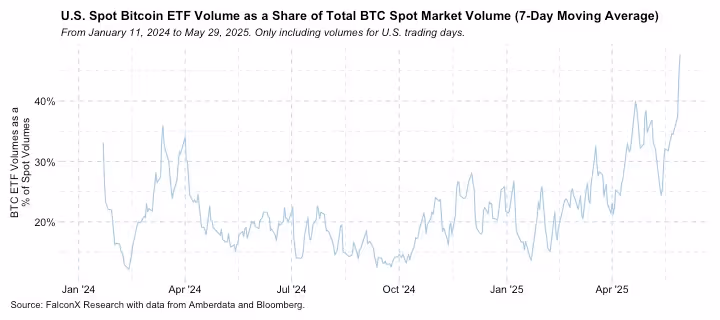
But perhaps the more compelling explanation is the growing market share of ETFs. The chart below shows BTC spot ETF trading volumes as a share of total spot volumes. While this figure hovered below 20% for most of 2025, it has been steadily climbing in recent months, and hit over 45% for the first time.
Interestingly, this spike in volume is happening as delta-neutral activity appears to be on the decline. According to the latest 13-F filings compiled by Bloomberg, total institutional holdings of BTC spot ETFs fell over the three months ending March 31, 2025, driven mainly by reductions from what seem to be delta-neutral investors. If that trend continued into Q2, the current volume surge is even more striking, as it’s likely being fueled by directional investors.
ETFs have had a strong showing since their debut in January 2024, and the momentum hasn’t slowed. Despite concerns that ETF holders would sell off during sharp downturns, the leading BTC spot ETFs saw no more than $250 million in daily outflows at the peak of the crisis. As the market rebounded, IBIT posted its strongest monthly inflows yet at over $6 billion.
All of this points to room for growth and suggests that ETFs are likely to remain a major force behind demand in this rally.
Another important shift is the wave of treasury companies, now expanding beyond BTC into majors like ETH and SOL. That trend is picking up incredible speed, but it’s an even bigger story that deserves a full breakdown of its own, which is coming soon.
This material is for informational purposes only and is only intended for sophisticated or institutional investors. Neither FalconX Limited, FalconX Bravo, Inc., FalconX Delta, Inc., FalconX Foxtrot Pte Ltd., FalconX Golf Pte Ltd., Solios, Inc., Falcon Labs, Ltd., KestrelX, Ltd. nor Banzai Pipeline Limited service retail counterparties, and the information in this material is NOT intended for retail investors. This material is not (i) an offer, or solicitation of an offer, to invest in, or to buy or sell, any interests or shares, or to participate in any investment or trading strategy, (ii) intended to provide accounting, legal, or tax advice, or investment recommendations, or (iii) an official statement of FalconX or any of its affiliates. Any information contained in this material is not and should not be regarded as investment advice, investment research, debt research, or derivatives research for the purposes of the rules of the CFTC or any other relevant regulatory body.
Prior to entering into any proposed transaction, recipients should determine, in consultation with their own investment, legal, tax, regulatory and accounting advisors, the economic risks and merits, as well as the legal, tax, regulatory and accounting characteristics and consequences of the transaction. Pursuant to the Dodd-Frank Act, over the counter derivatives are only permitted to be traded by "eligible contract participants" (“ECP”s) as defined under Section 1a(18) of the CEA (7 U.S.C. § 1a(18)). Do not consider derivatives or structured products unless you are an ECP and fully understand and are willing to assume the risks.
Solios, Inc. and FalconX Delta, Inc. are registered as federal money services businesses with FinCEN. FalconX Bravo, Inc. is registered as a Swap Dealer with the U.S. Commodities Futures Trading Commission and is a member of the National Futures Association. FalconX Limited, FalconX Bravo, Inc., FalconX Delta, Inc., Falcon Labs Ltd., and Solios, Inc. are not registered with the Securities & Exchange Commission or the Financial Industry Regulatory Authority. FalconX Golf Pte. Ltd. is not required to be registered or licensed by the Monetary Authority of Singapore (MAS). MAS has granted FalconX Foxtrot Pte. Ltd. a temporary exemption from holding a license under the PSA for the payment services caught under the expanded scope of regulated activities for a specified period. FalconX Limited is licensed by the MFSA as a Class 2 Crypto-Asset Service Provider (Regulation (EU) 2023/1114). It is also licensed as a Financial Institution (Cap. 376) exclusively for EMT payment services.
"FalconX" is a marketing name for the FalconX Group and its affiliates. Availability of products and services is subject to jurisdictional limitations and capabilities of each FalconX entity. For information about which legal entities offer trading products and services, or if you are considering entering into a derivatives transaction, please reach out to your Sales or Trading representative.